Understanding your account usage
Learn how to review your account usage in Klaviyo.
*NEW* The standalone Account usage tab is gone. Current usage now lives on the Plans tab (Overview) as a card per product, and historical usage lives on each product's own plan detail page, one click away via View.
Note: Only Owners, Admins and Managers can access billing usage details.
What is account usage?
Account usage is a record of how much of each Klaviyo product you've used against your plan: Active Profiles, Email, Mobile, WhatsApp, Reviews, Advanced KDP, Helpdesk, and Customer Agent.
How is account usage measured?
If you're on a monthly plan, it's shown as a count against your plan's limit. If you're on a contract, it's shown as a percentage of what you've contracted for. Either way, it's the source of truth for what you're being billed for and whether you're on track to hit a limit or overage.
How often does my usage reset?
Usage is tracked over your usage cycle, the recurring window your usage resets on.
Your usage cycle is aligned with your billing cycle: if you started paying on the 15th, your usage cycle runs from the 15th to the 14th of the following month. Free accounts use the 1st of the month instead.
For self-serve (credit-card) accounts, your usage cycle is aligned with your billing cycle and runs on Eastern Time. For manually billed (contracted) accounts, your usage cycle follows your contract terms and runs on your contracted company's own time zone rather than Eastern Time.
Learn more about your Usage and Billing cycle here.
How should I use account usage?
Check current usage when you want a quick read on whether you're approaching a limit this billing cycle, so you can plan ahead before hitting an overage or before service is affected.
Check historical usage when you're looking at trends, such as whether your send volume is growing month over month, when deciding if it's time to change plans, or when you need a downloadable report for finance or reconciliation.
If you are part of an Account Family and utilize shared billing, your usage and limits may be shared across accounts.
Where to find your usage now?
What it is: Usage information now lives in two places: a Plans tab (Overview) with one card per product, and a plan detail page for each product with a deeper daily and historical view.
Why it's here: The old standalone Account usage tab kept current and historical usage separate from your plan and cost information. Folding usage into the Plans experience means you see what you're using and what it costs in the same place.
What it lets you do:
- See current-cycle usage at a glance on the Plans tab.
- Click View on any card to open a daily usage chart for the current cycle, plus historical usage going back up to 12 months.
Where to find it: Settings > Billing > Overview, then View on any product's card.
What plans can I view usage for?
Our Current Usage Graphs in (Settings > Billing) only show usage for free and paid products.
To see usage for products that have a free trial or free access period, please use the Explore Products tab on the upper right hand section of your Klaviyo dashboard. Note: Historical Usage is provided for Composer during the free access period.

For all non-contracted accounts (including those using shared billing), the Account usage tab breaks down the usage of each plan for that account; e.g., how many emails and SMS you’ve sent.
If you are manually billed (via a contract), you will see your usage as a percentage of your contracted amount.
How often the account usage updates
The Billing Overview tab contains horizontal bar graphs & cards which reflect usage for your current usage or billing cycle. This Usage updates in near real time and should reflect your usage accurately per product. If you're checking whether you're about to hit a limit today, this is the number to trust.
The Plan Detail pages when you hit “View” reflect your historical usage and does not contain real-time data (its approximately 15 minutes to 1 hour behind your real time actions). This means that if you send a campaign and immediately check the Plan Detail page for that product, it won’t reflect the impact from that campaign.
Account families: parent and child accounts
If your accounts are linked for shared billing, a few extra terms and rules apply:
| Term | Definition |
|---|---|
| Account family | All accounts linked together for shared billing |
| Parent account | Holds the billing details and plan info for the account family |
| Child account | An account linked to a parent account within the family |
Usage is pooled across the whole account family. For example, sending an email campaign to 1,000 people from a child account counts toward the send total for every other account in the family, not just that child account.
Access also differs by account type: the parent account has full access, including the ability to view usage for each individual child account. Child accounts have more limited access, and in most cases can't reach certain billing pages. A parent account Owner or Admin can change this under Billing > Preferences, where they can choose to let users in every account view plan usage across the family.
See Understanding how shared billing works in Klaviyo for full detail on requesting and managing shared billing.
Point-in-time vs. consumption usage
Usage is charted differently depending on the product:
- Point-in-time / snapshot – Active Profiles, Advanced KDP, and Marketing Analytics. Usage accumulates throughout the lifetime of the account and does not reset.
- Consumption – Email, SMS, and Reviews. Usage accumulates through the cycle, so the curve grows and then resets at the beginning of the usage cycle.
Current usage
This section covers where to check your usage right now and how Klaviyo warns you as you approach a limit.
View your current account usage
- Click your account name in the bottom left corner.
- Click Billing > Overview
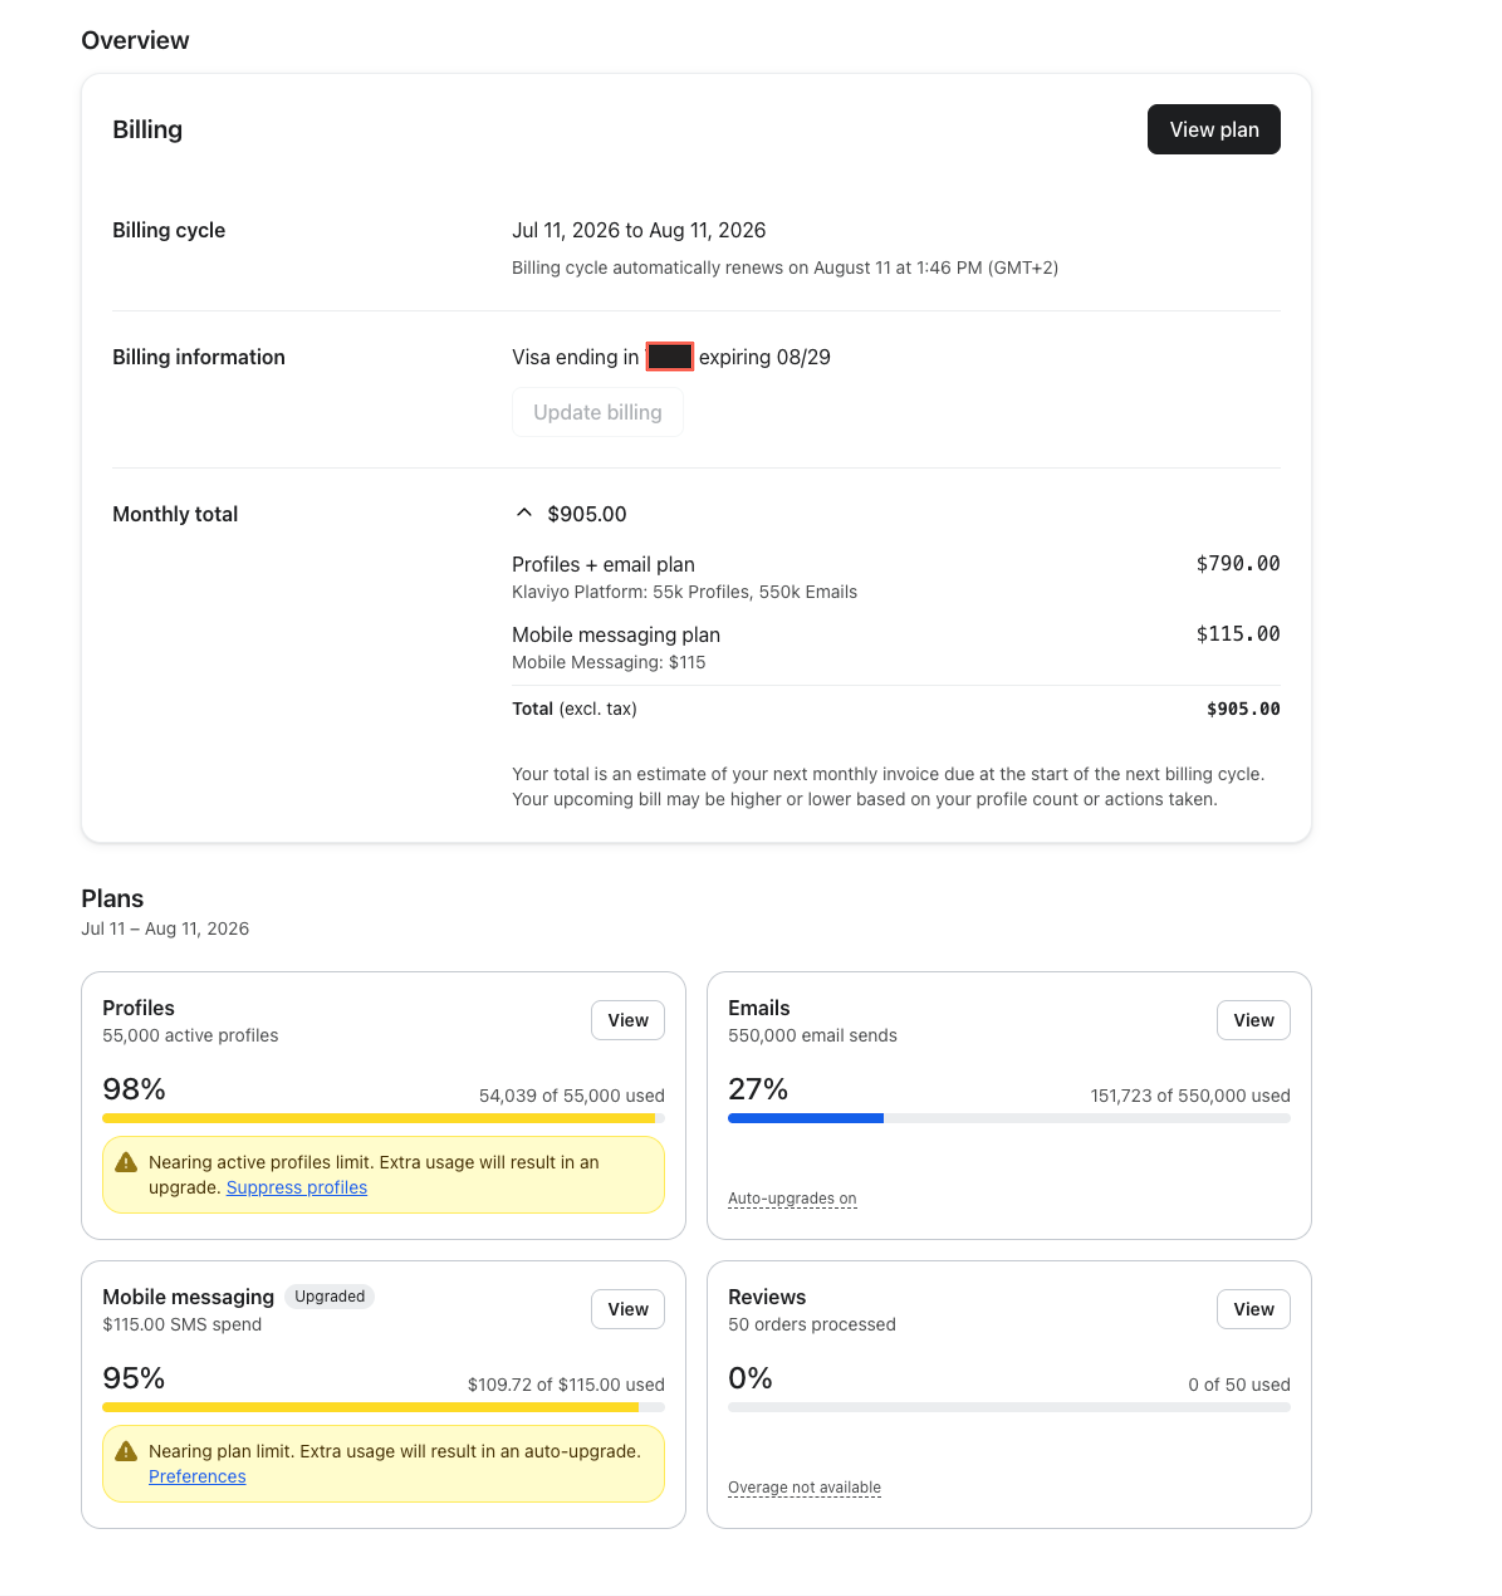
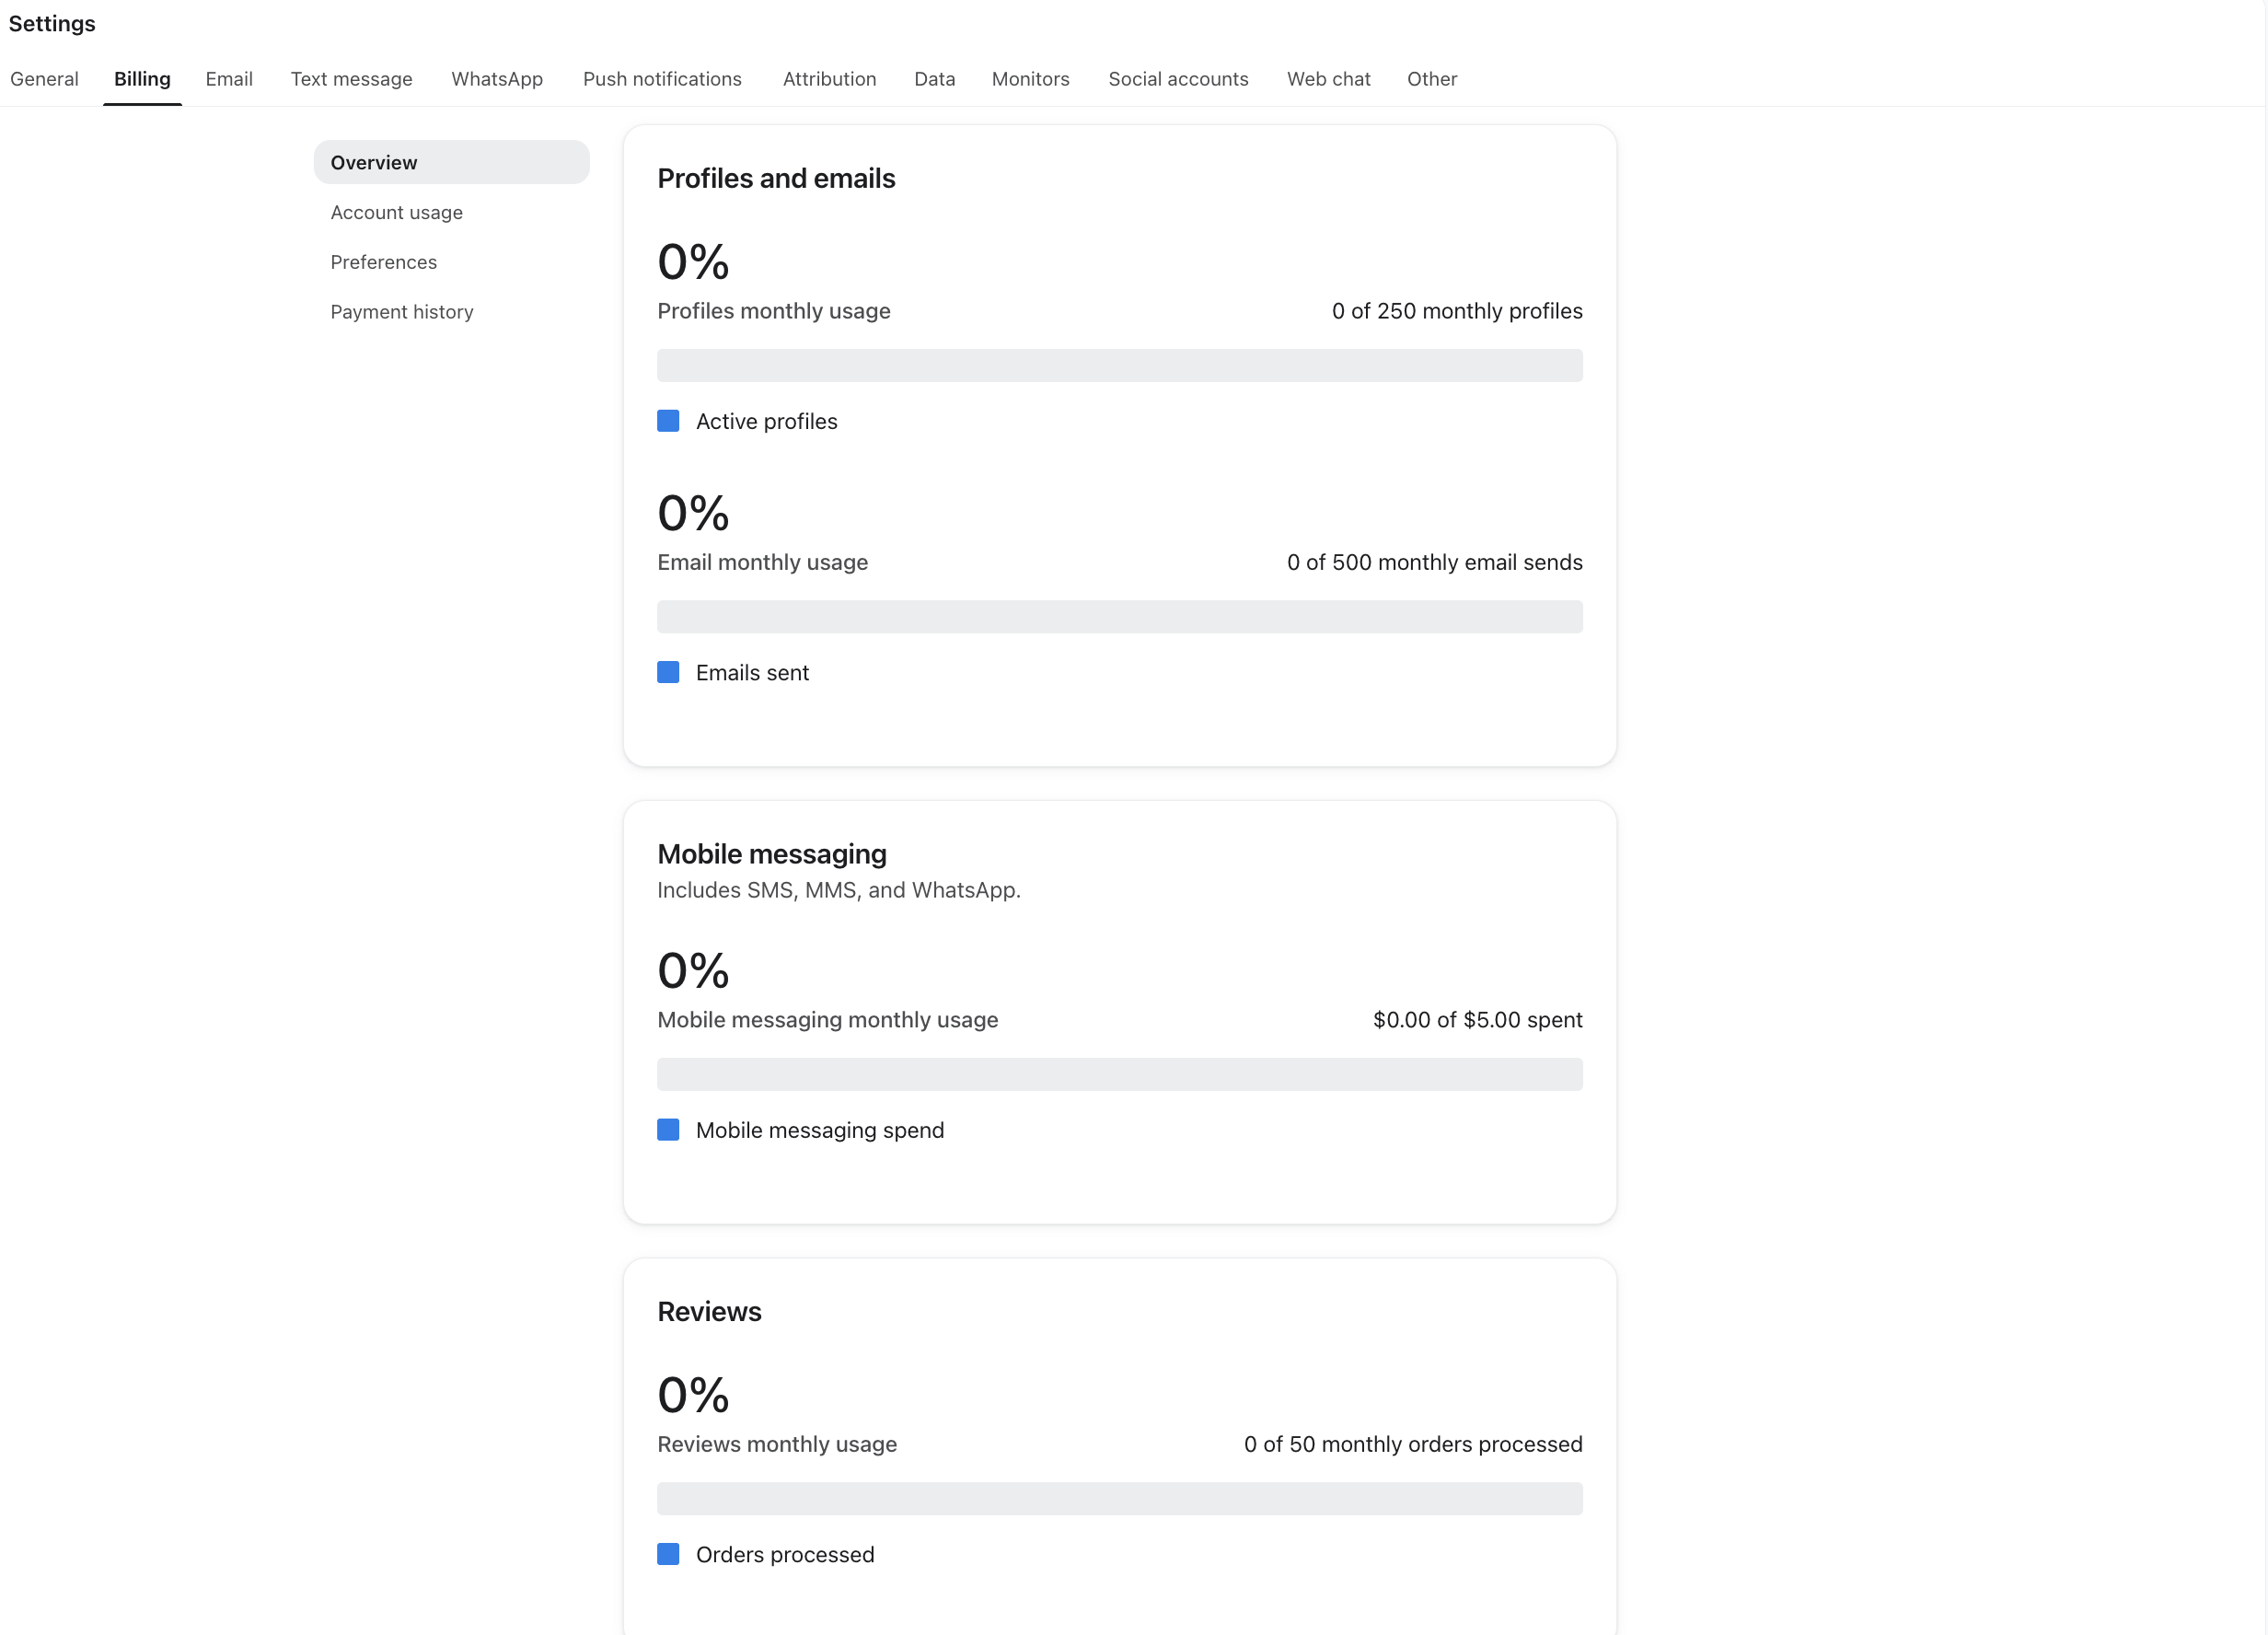
- Current usage will appear for your current billing cycle for each product type you have access to (Free and Paid). You will see the amount used against your total limit.
- Usage resets based on your billing cycle.
- If you are paying via monthly subscription, you will see this usage reset once a month on your usage/billing cycle.
- If you are a Manually Billed customer, usage will reset according to the usage terms in your contract.
New UI Views (As of August 3rd, 2026)
Older Views
How often the account usage graph updates
The Usage graph updates immediately in real time based on your usage.
Current usage card colors
Klaviyo uses visual indicators to alert you to when you are nearing or exceeding your account limits.
| Color | What it means |
|---|---|
| Blue | Under 80% of your plan limit used. |
| Yellow | 80% or more used — approaching your limit. |
| Red | 100%+ used with no overage coverage in place. Usage is enforced or blocked |
Note: These card thresholds (80% amber, 100% red) are separate from your email/in-app usage notifications, which still send at 75%, 90%, 95%, and 100% (see Account Usage Notifications below).
Active Profiles cards turn red at 100% even with auto-upgrade or flex enabled, since profile limits are always enforced for compliance.
Account usage notifications
Klaviyo lets you know proactively if you are approaching your monthly usage limit via in-app notifications and email notifications. Email notifications are sent to the account owner's email address.
If you are a monthly subscription customer, you will receive email notifications when you hit the following thresholds: 75%, 90%, 95% and 100%. If you are a contract customer, you will receive email notifications at the following thresholds: 75%, 90%, 95%, 100%, 110%, 125%, 150%, 200%.
| Billing type | Notification thresholds |
|---|---|
| Monthly subscription | 75%, 90%, 95%, 100% |
| Contract | 75%, 90%, 95%, 100%, 110%, 125%, 150%, 200% |
Current usage for account families
What is an account family?
An account family is a billing structure where all accounts are linked together for shared billing. The Parent account holds the billing details and plan info for the account family. The child account is an account linked to a parent account within the family.
How is usage shared across account families?
Usage is pooled across the whole account family. Sending an email campaign to 1,000 people from a child account counts toward the send total for every other account in the family, not just that child account.
Where can you view current usage?
On the Overview tab, a parent's usage cards default to showing the family's aggregate usage. On a plan detail page, Parent accounts can view an Account Family Breakdown table showing each account's current usage and share of the family total, and can search by account name or KID to isolate one account. Child accounts only see this breakdown if the parent has enabled “Allow users in all accounts to view plan usage for each account in the family” under Billing > Preferences.
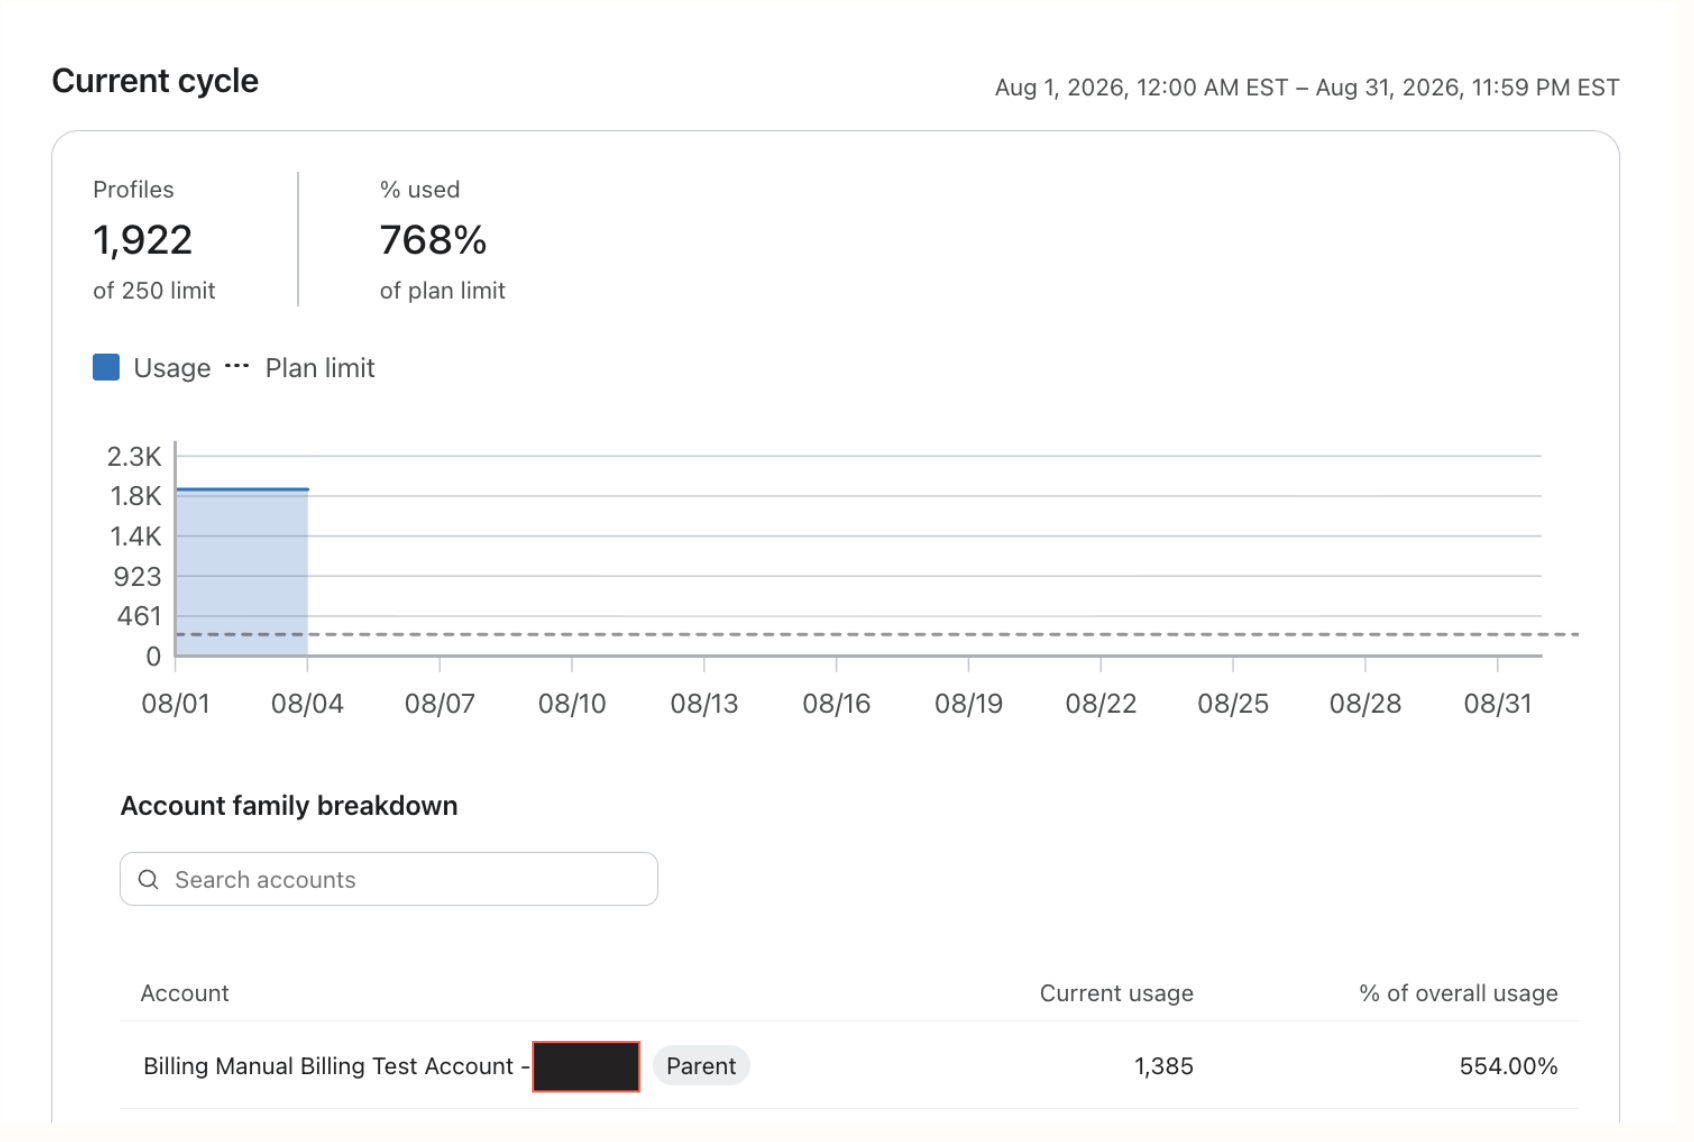
If you're part of an account family, the parent account can always view current usage for itself and for every linked child account. Whether child-account users can also see this depends on the preference set in the parent account under Billing > Preferences ("Allow users in all accounts to view plan usage for each account in the family"). Notification thresholds apply to the family's pooled usage, not to each child account individually.
Learn more about Account Families and Shared Billing here.
Was I upgraded recently? How can I tell?
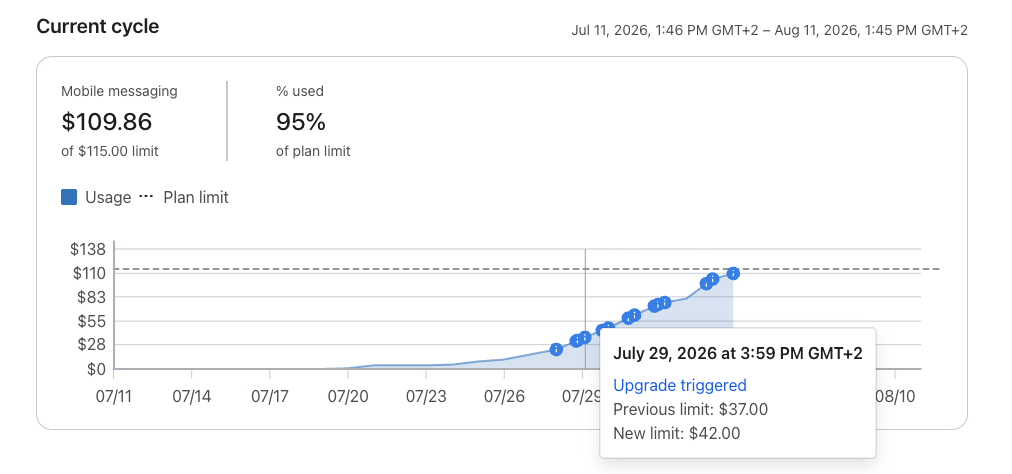
When you surpass or exceed a limit during your current cycle, you can see upgrades reflected on the current usage graph.
Note: When you exceed a limit and have opted-in to our Billing Preferences, Auto-upgrade or Flexible overages, the dotted line denoting your limit threshold will adjust accordingly.
Historical usage
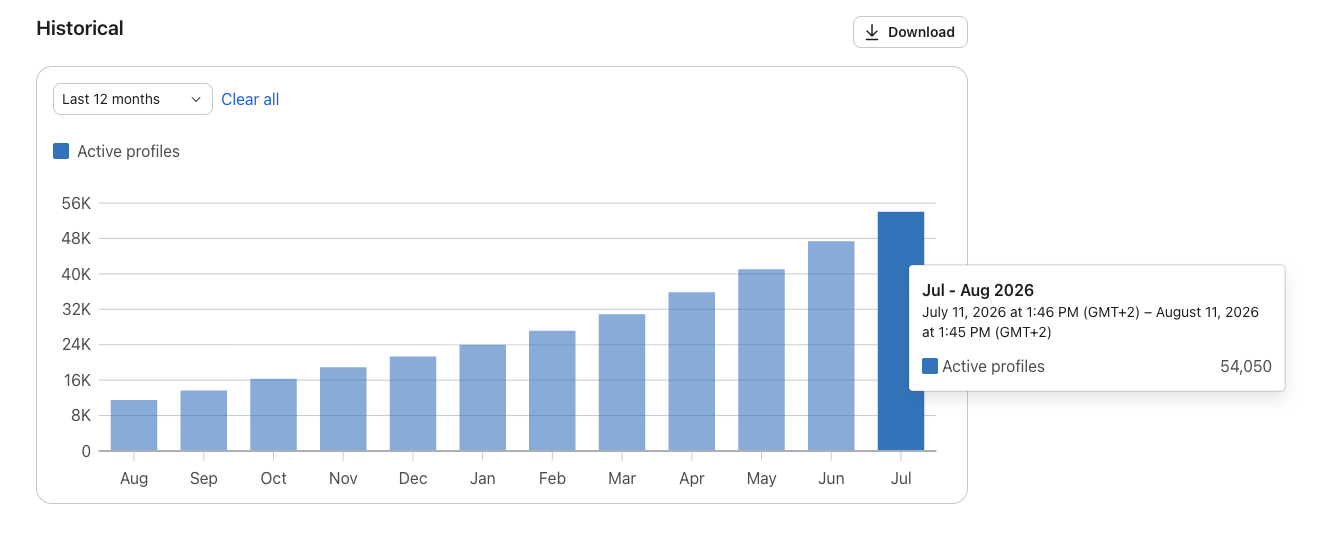
This section covers reviewing usage trends over time, by category, plus downloadable reports and your plan change history. You can view historical usage over the last 3, 6, or 12 billing cycles. Only paid and free plans show historical usage; free trials do not.
You can filter or break down historical usage by:
- Message/ticket type: for Email & SMS — Overall, Campaigns, Flows, Conversations, or Other. For Active/Total Profiles — Overall only.
- Mobile Messaging units: a Credits / Messages / Spend toggle (Spend is the default view). Switching units resets your selected time range back to the default, so reapply your 6- or 12-month view if you switch units mid-review.
Your filter and time-range selections are remembered only for your current browser session; they reset if you switch devices or clear your browser data.
Historical usage for account families
From the parent account, you can drill into any child account to see that account's individual historical usage across all categories below. Charts viewed from the parent account by default reflect the whole family's pooled usage; click into a specific child account for its own numbers.
See Understanding account billing details in a portfolio if you manage the family from a portfolio view.
You can view your usage over the last 3, 6, or 12 billing cycles.
To check your historical account usage:
- Click your account name in the bottom left corner.
- Click Billing Overview for current cycle usage.
- Select the product card of your choice. Hit “View”
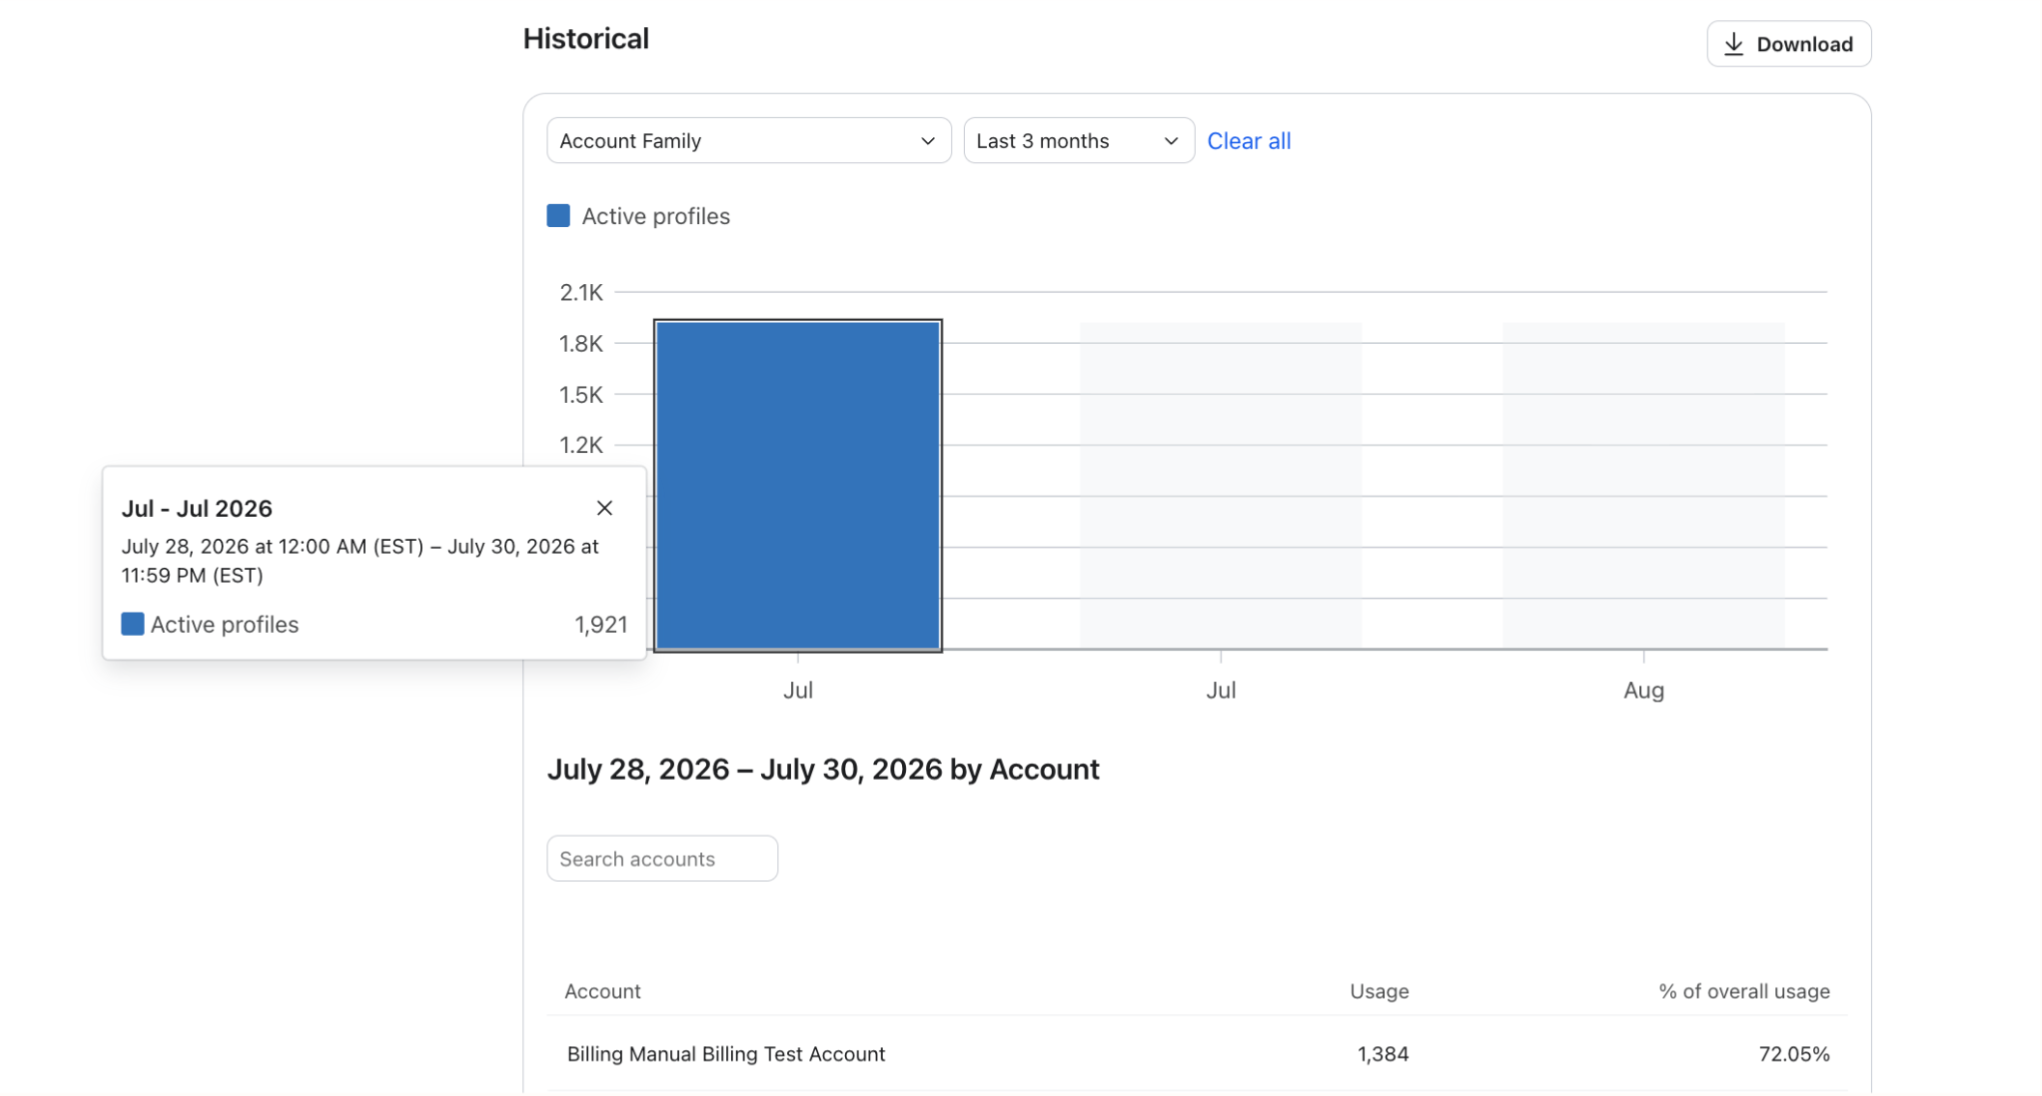
If you are manually billed, note that Klaviyo shows usage as a percentage of your total contracted amount. If you've gone over your plan limits, you'll also see the overage amount.
You will only see past Account Usage for paid plans or free plans. Plans with free trials will not display here.
How often the historical account usage updates
The Historical Account Usage graph is updated approximately 15 minutes to 1 hour behind your product usage in real time. It is also refreshed several times a day and reflects data through the previous day, within your current usage cycle.
It is not real time: if you send a campaign and immediately check the Account usage tab, it won't yet reflect that campaign.
Usage for Klaviyo Products
Active profile usage
View Current & Historical Active Profile Usage
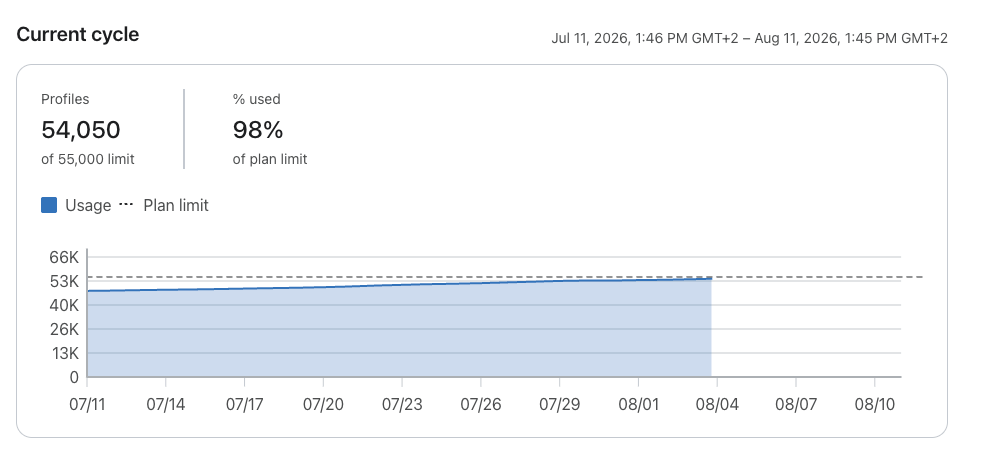
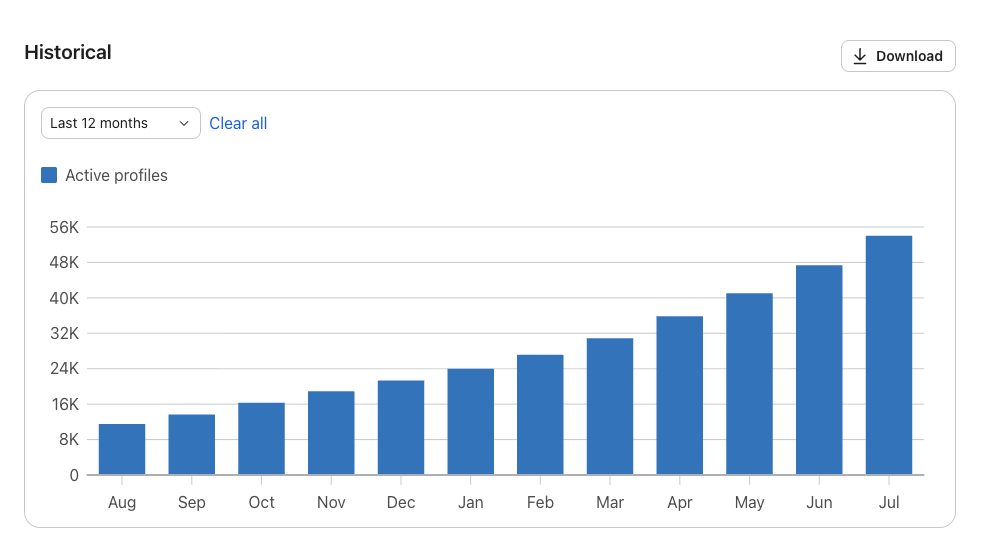
Shows how many active profiles (any profile that can be messaged through Klaviyo) you had per usage cycle. Suppressed, unsubscribed, and deleted profiles don't count.
Your usage cycle matches your billing cycle for paid accounts (e.g., if billing starts on the 15th, your cycle runs the 15th to the 14th). Free accounts use the 1st of the month.
All products that use Active Profiles as a meter share this same detail page and historical usage graph (Profiles & Emails, Customer Hub, Social Marketing, and Marketing Analytics).
Note: Usage before February 2023 is estimated; usage from that point forward is exact.
Why your active profile count may look out of date after a cleanup
What it is: A short delay between when you suppress, delete, or bulk-remove profiles and when your billing usage reflects the smaller count.
Why it's here: Active profile counts feed both your usage cards and the plan picker at checkout, so Klaviyo needs a short window to fully process large changes before those numbers update everywhere.
What it lets you do:
- It can take up to 72 hours for your active profile count on the Plans tab to fully reflect a large cleanup.
- During that window, if you try to change plans, checkout still uses your prior (higher) profile count, so you may not yet see the cheaper plans you expect.
- Once your active profile count has refreshed, Klaviyo's built-in plan check keeps you from accidentally selecting a plan that's smaller than your real active profile count, even if an older, cheaper-looking option is visible in the dropdown.
Where to find it: Settings > Billing > Overview (current count) and Billing > Change plan (plan dropdown list).
Email usage
View Current & Historical Email Usage
Under email usage, you can check how many total emails you sent in the current and previous billing cycles.
- Total emails sent (under Overview)
- Number of emails sent via campaigns versus flows (under Message types)
Mobile messaging usage
View Current & Historical Mobile Usage
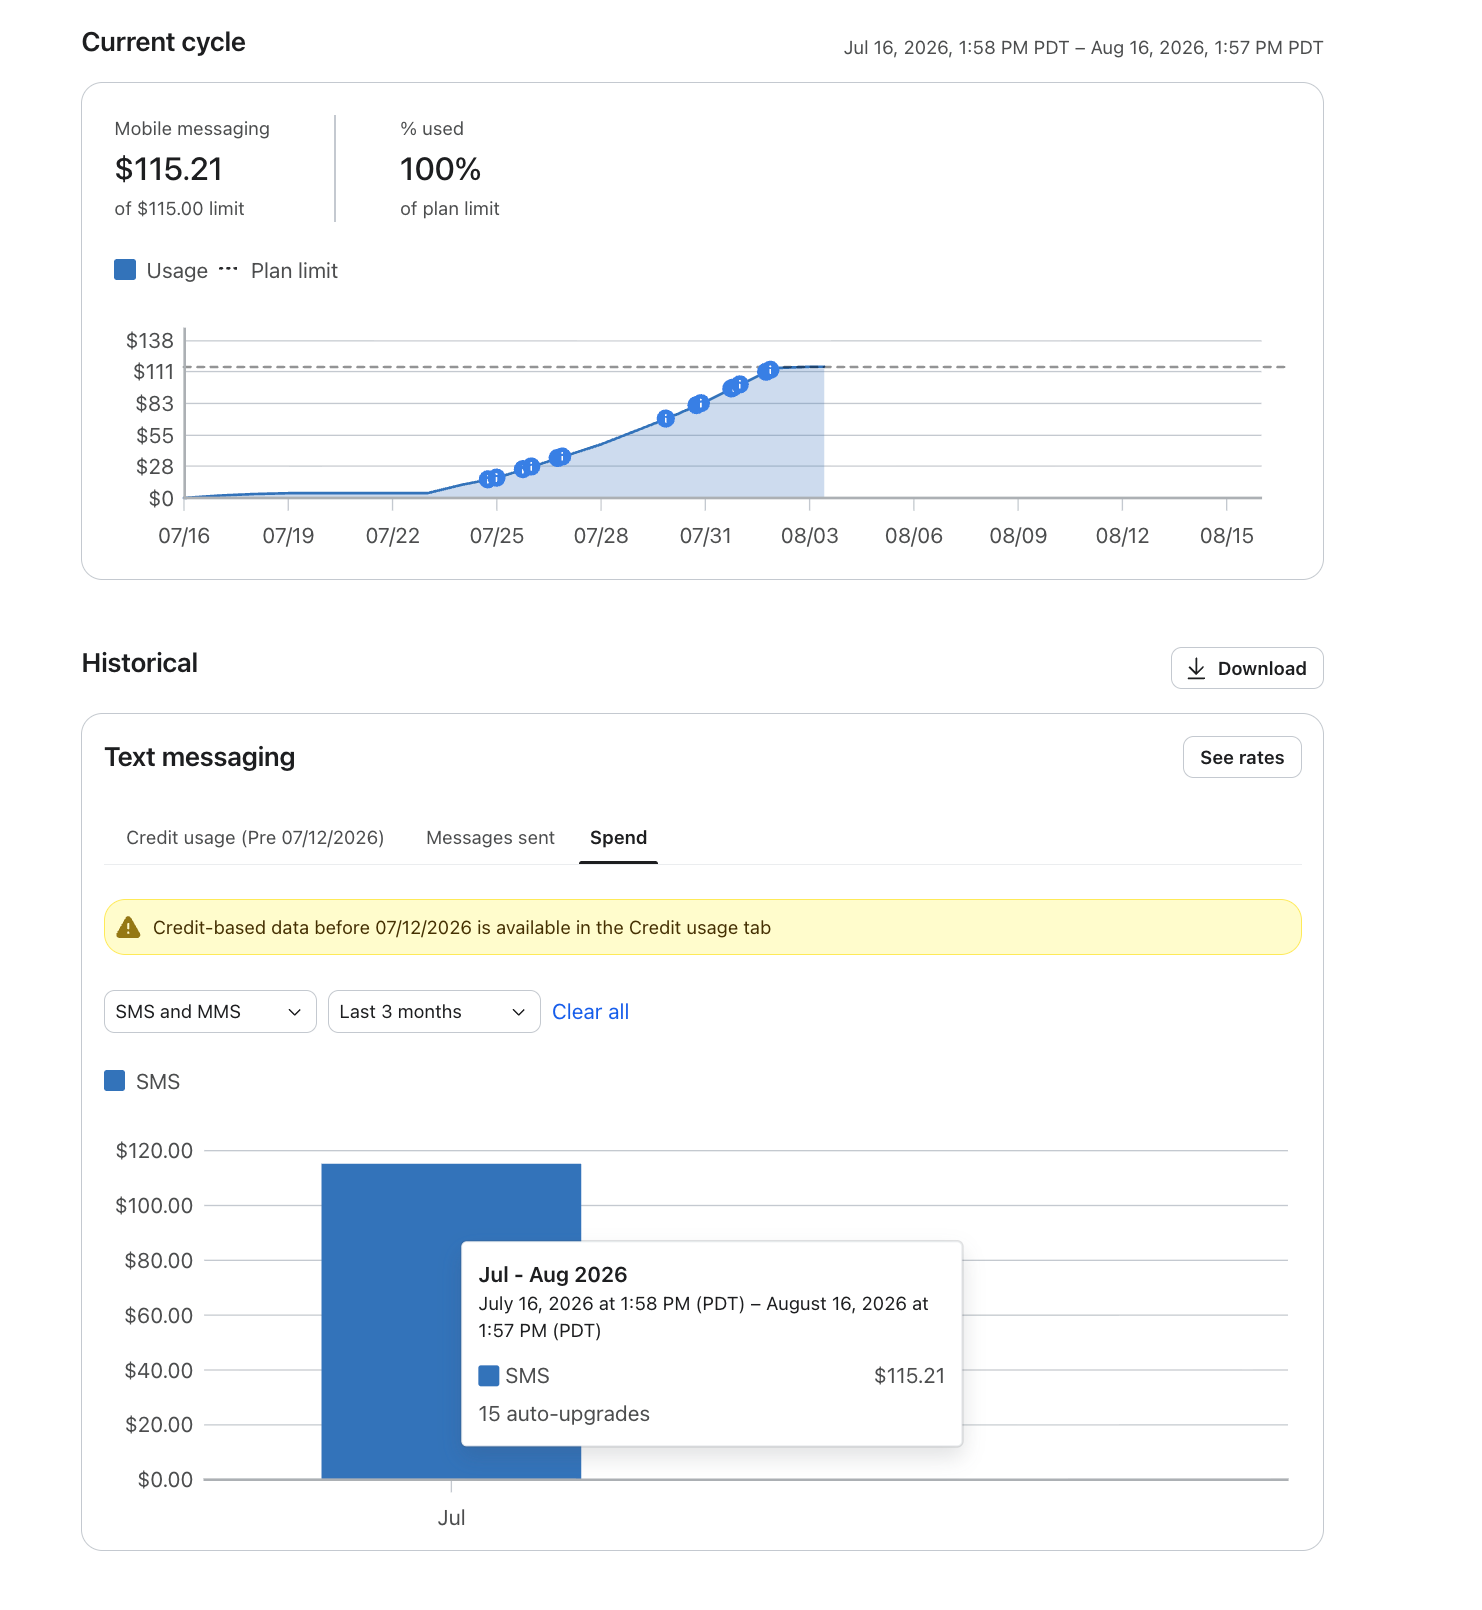
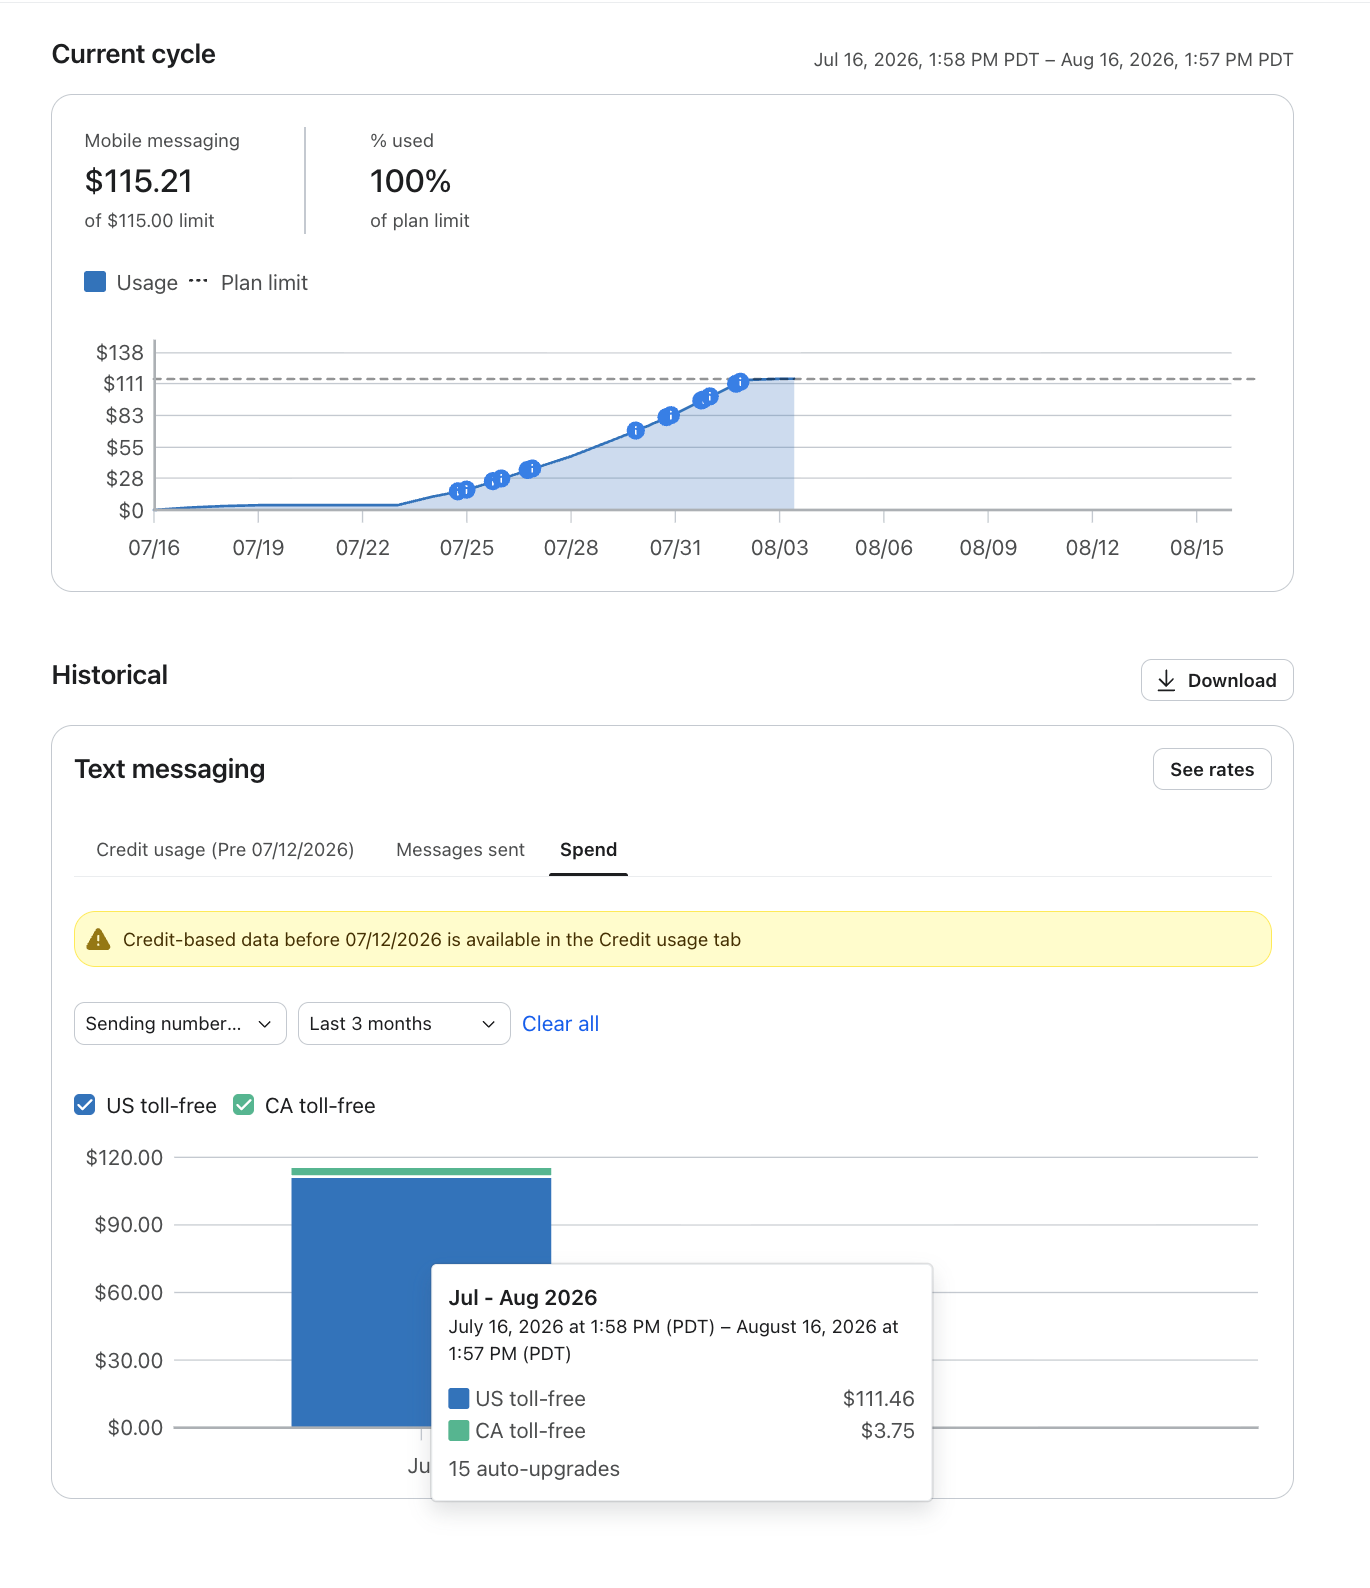
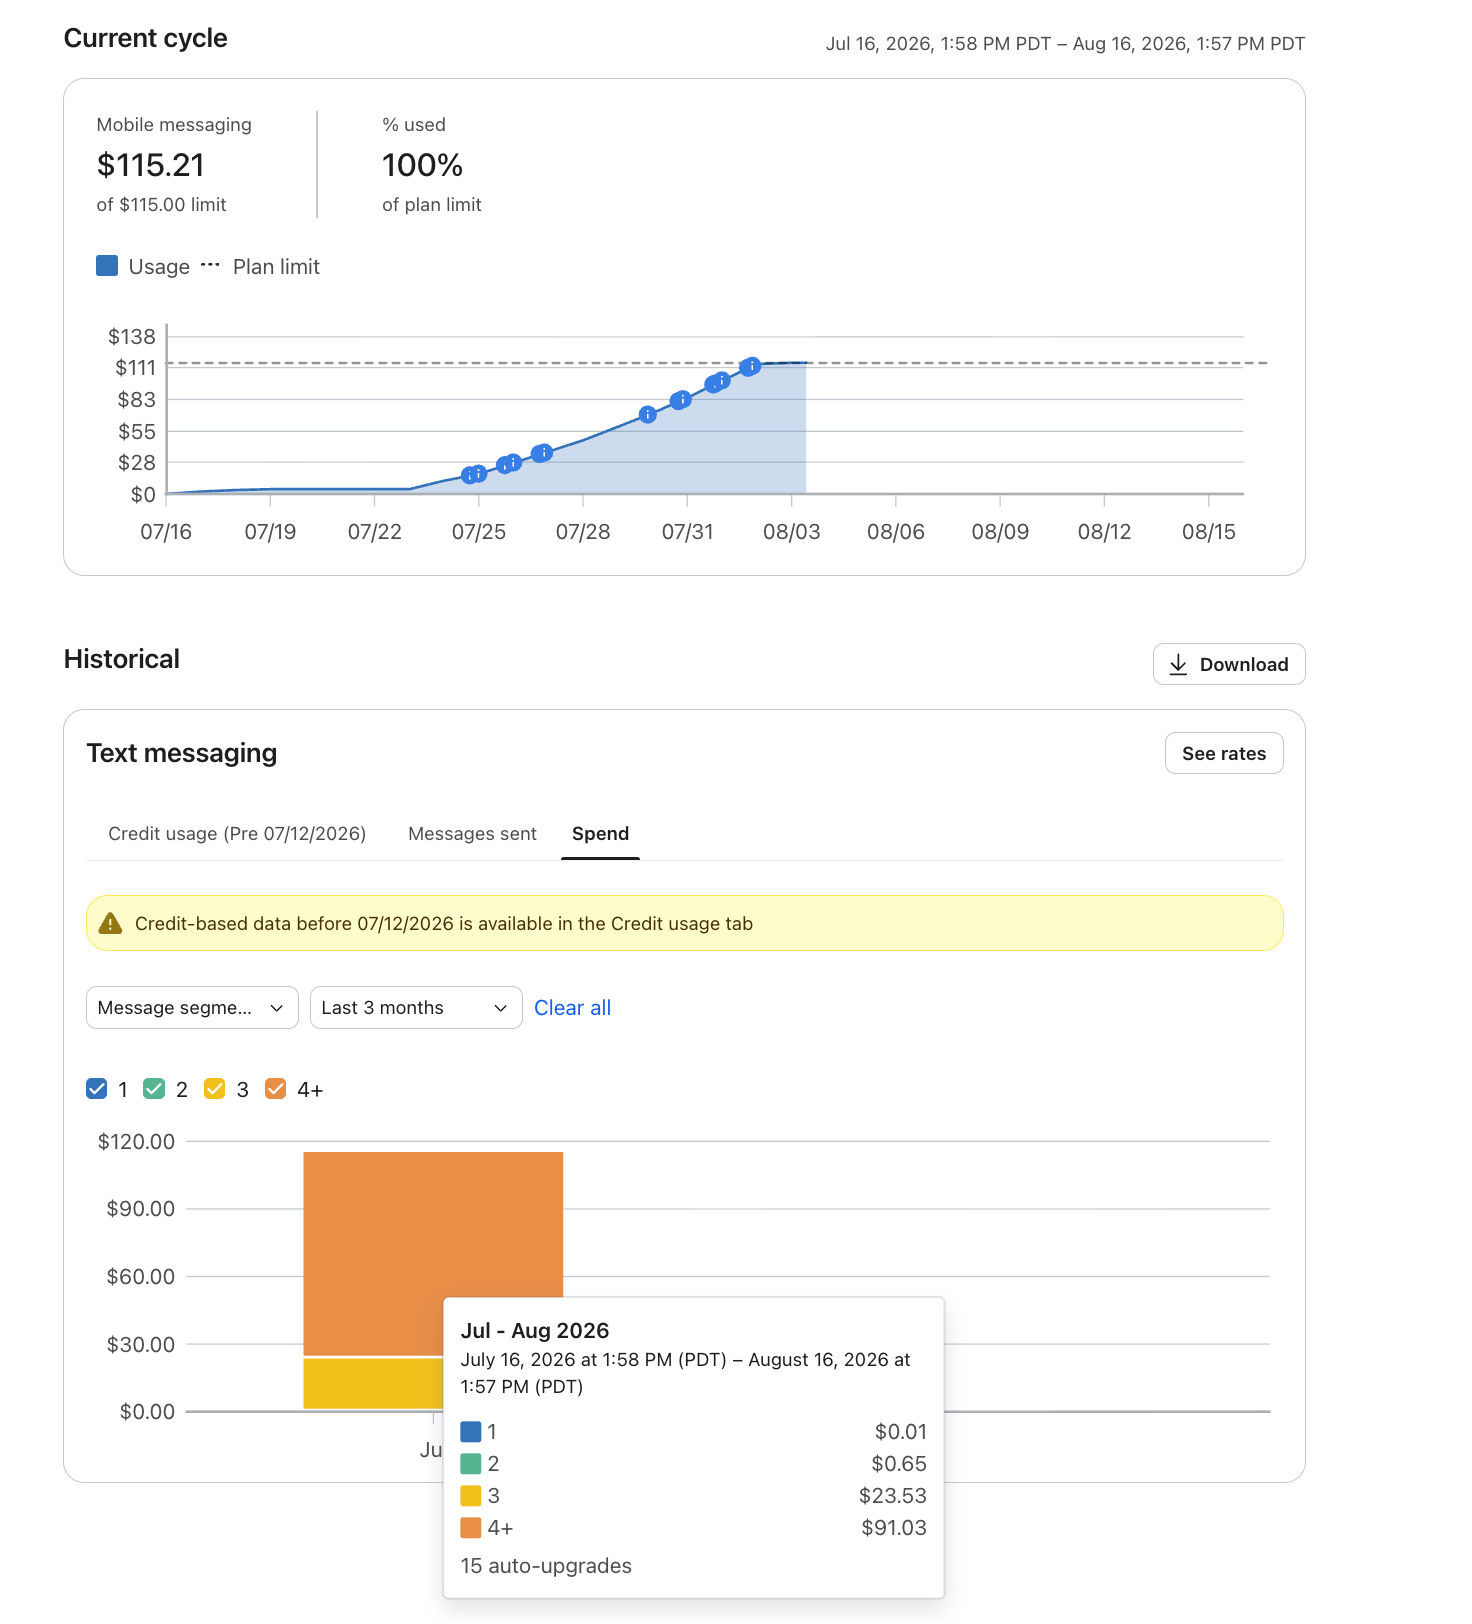
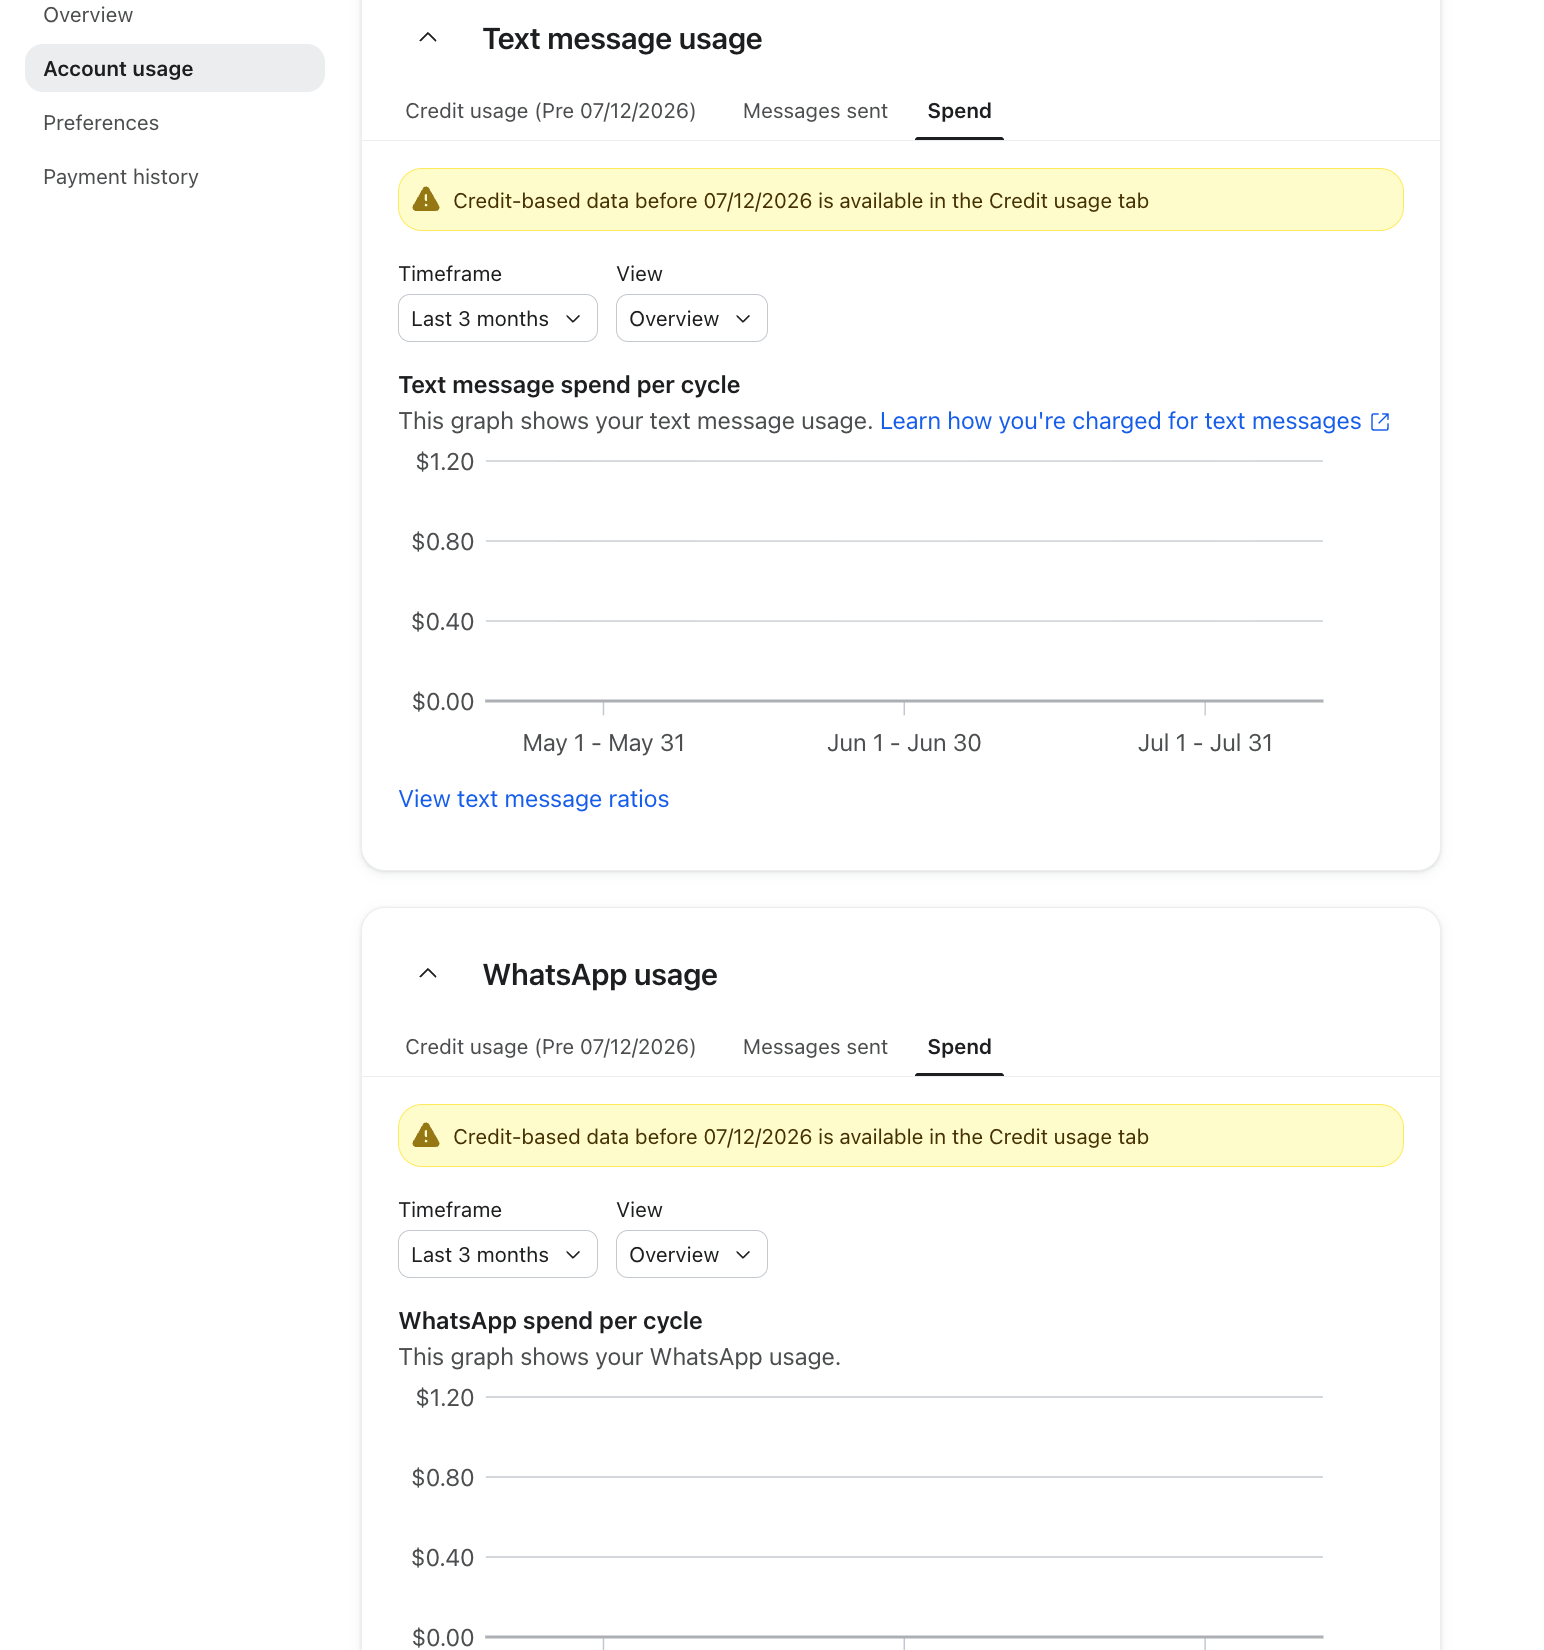
For Mobile Messaging plans, there are separate graphs for Text Messages vs Whatsapp. The Text Message graph includes usage for SMS, MMS, and RCS.
The Whatsapp graph includes usage for Whatsapp only.
2 tabs showing your usage:
- Messages sent - # of Messages sent during the cycle
- Spend - Spend against your mobile plan limit during the cycle
Text message filters
The next graph shows your historical SMS credit usage, including:
- Total credits used (under Overview)
- Usage in campaigns versus flows (under Message types)
- Usage for SMS versus MMS (under SMS and MMS)
- Usage per message segment (under Message segments)
- Credit usage by country (under Countries)
For more information on credits, check out our article on Klaviyo’s SMS credit system.
WhatsApp message filters
The WhatsApp message usage shows how many messages you’ve sent (but does not show how many credits you’ve used). It shows:
- Total WhatsApp messages sent (under Overview)
- WhatsApp sent via campaigns versus flows (under Message types)
- Usage for Marketing vs Transactional messages (under Message intent)
- Usage for WhatsApp specific message types (Klaviyo only offers message templates)
- Countries the messages were sent to (under Regions)
Note: You may see a third tab with “Credits” if you had a Mobile Messaging plan with active usage prior to July 13, 2026. If your account has migrated to rate-based mobile pricing, the Credits tab shows the date your account transitioned to the new rate card, so you can tell which portion of your history reflects the older pricing versus the new rates. Learn more here.
Composer usage
View Current & Historical Composer Usage
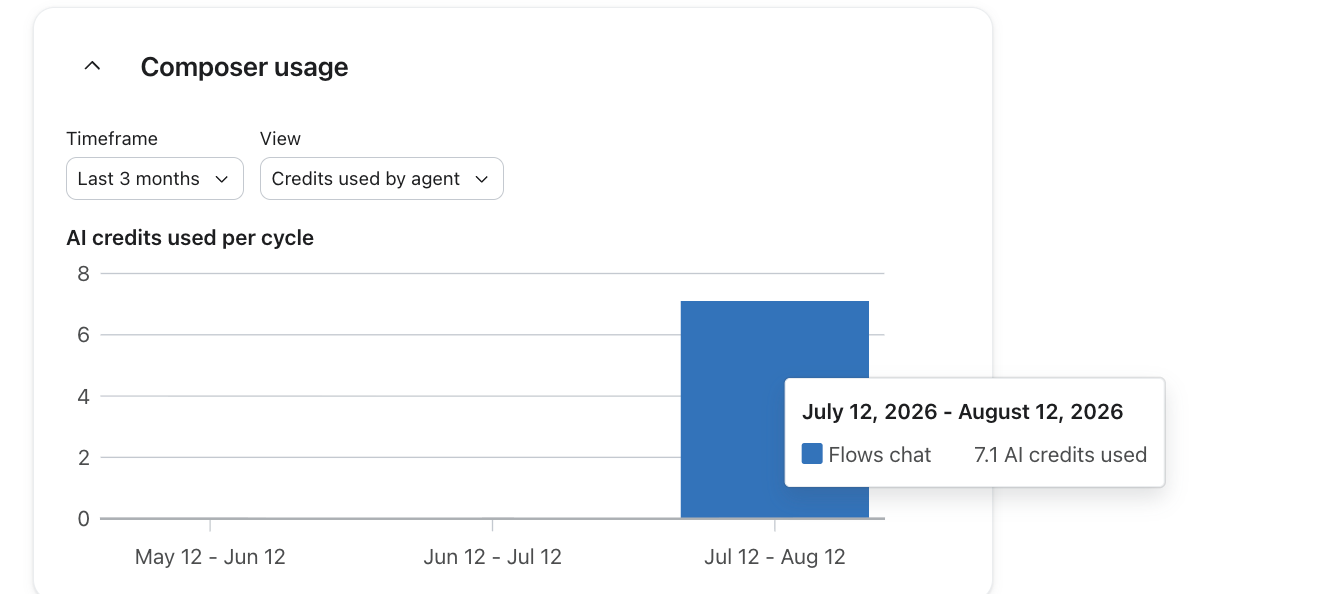
Composer plans are based on the number of AI credits you’ve used within a billing cycle. In the Composer usage section, you can see how many AI credits were placed over the past 3, 6, or 12 billing cycles.
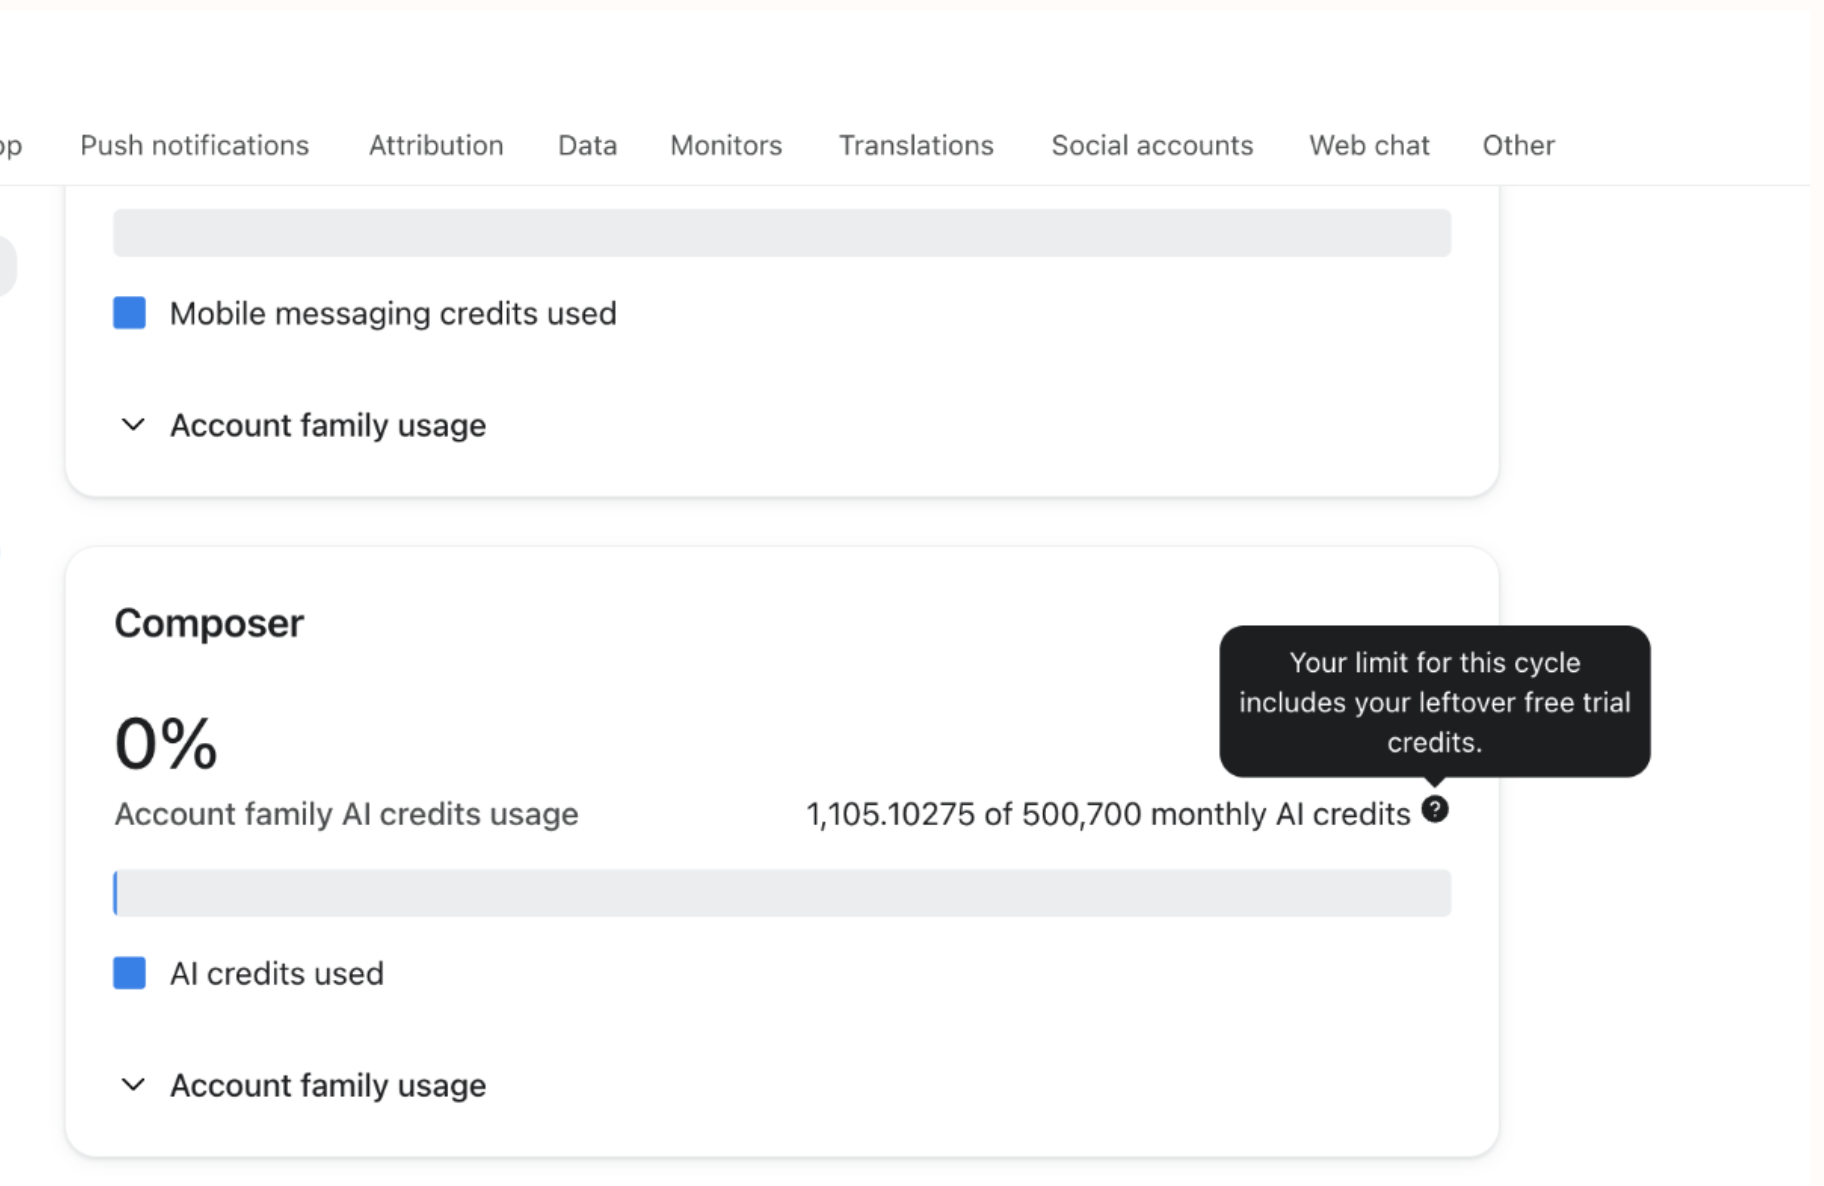
When you navigate to the Account Usage tab for your historical view, you can also view a breakdown of the number of credits you have used per agent.
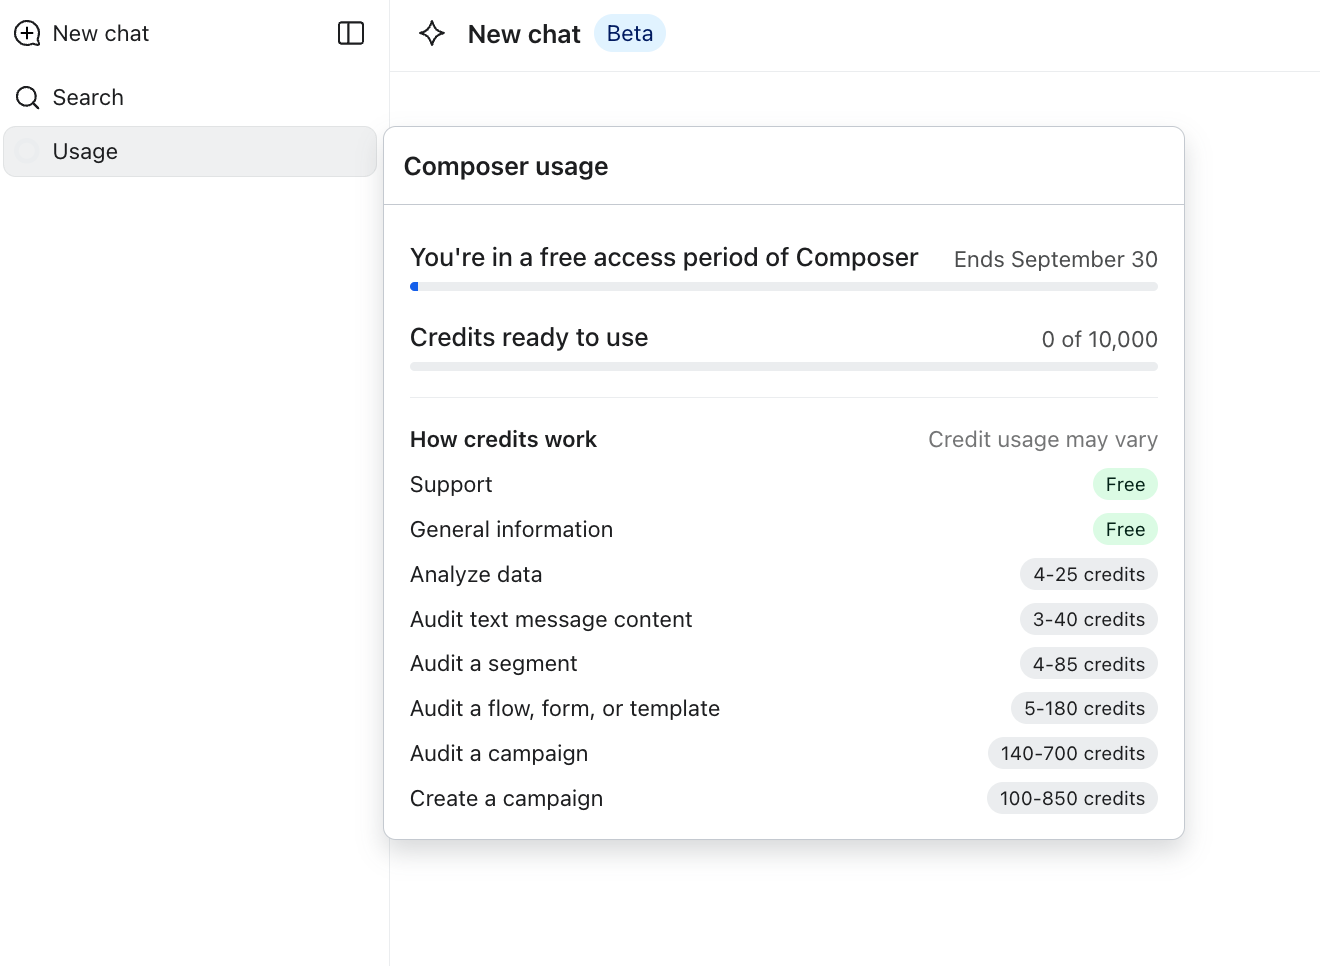
Composer usage is available to view anytime via the In-Chat Composer Usage Tab. Click the tab to view the modal which represents real-time usage during your current billing period.
*If you have credits left during your free access period of Composer, you will see them here. If you have purchased Composer, these credits will reflect the availability of the plan you’ve paid for and will reset monthly.
Reviews usage
View Current & Historical Reviews Usage
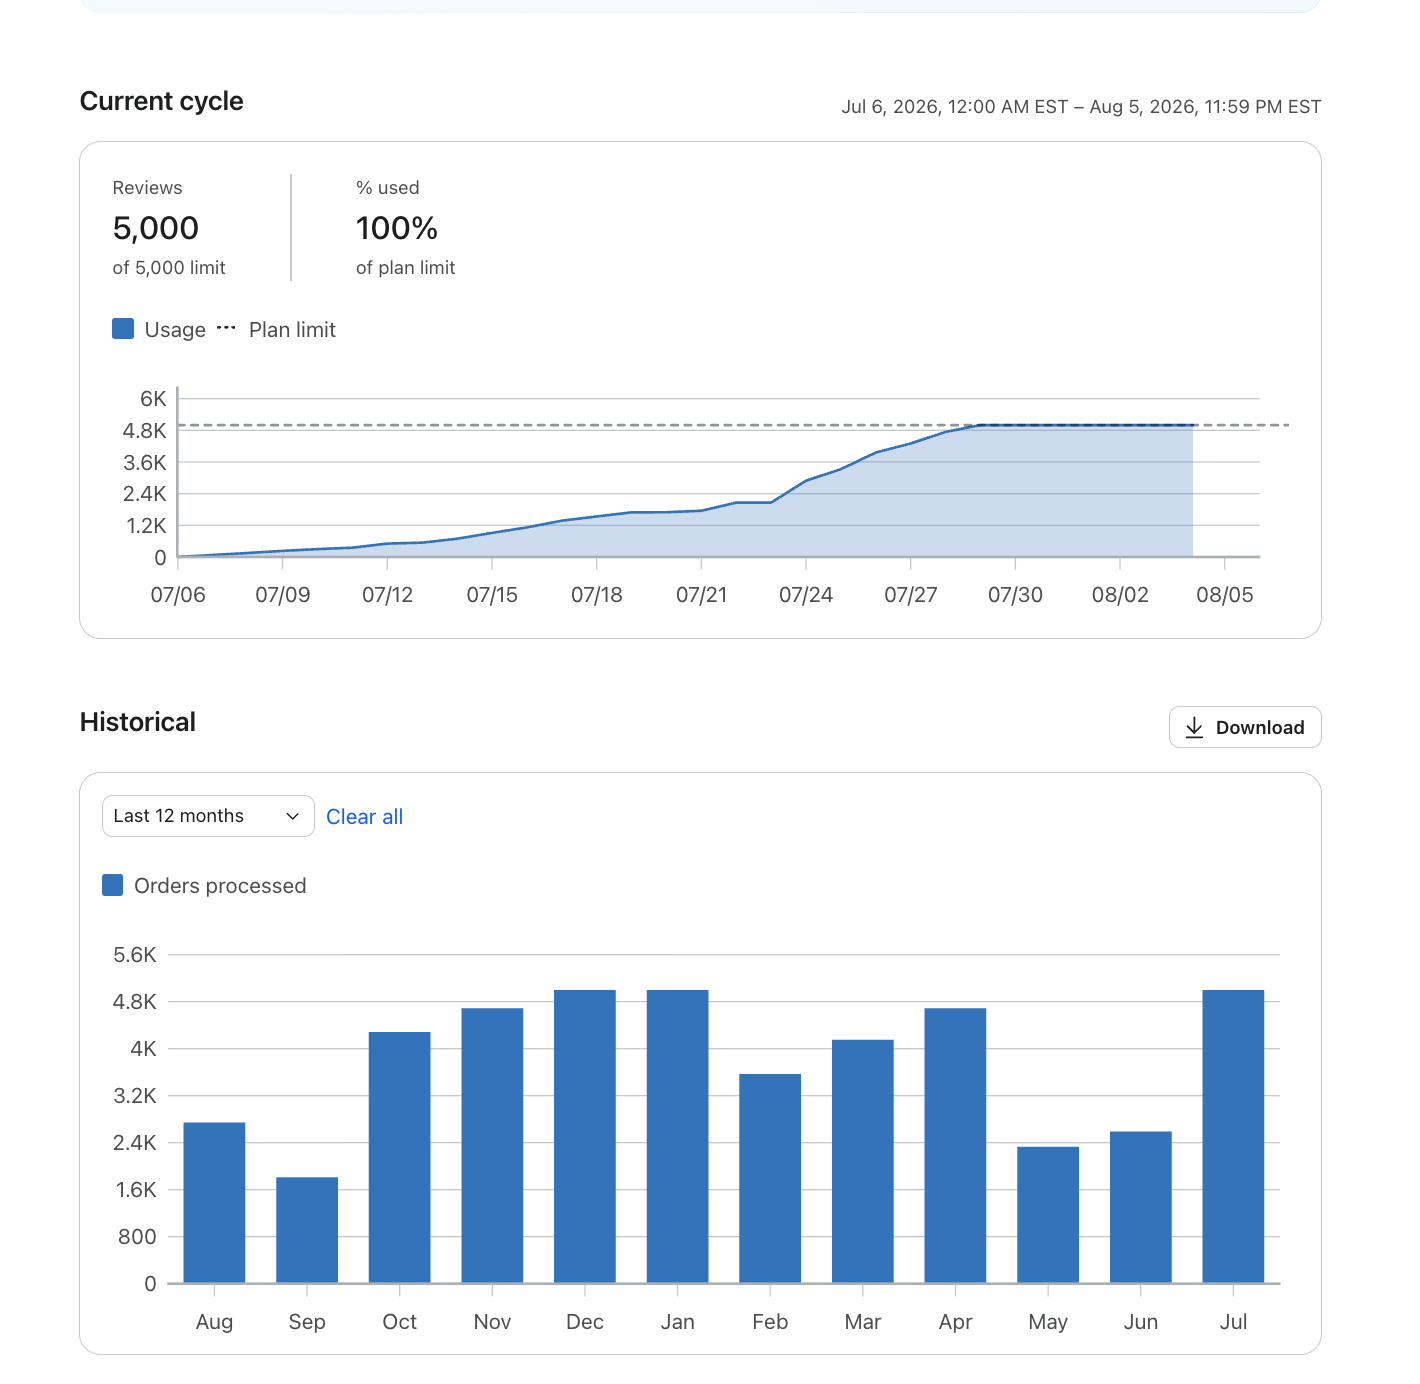
Reviews are metered on Orders. Review plans are based on the number of orders placed within a billing cycle. In the Reviews usage section, you can see how many orders were placed over the past 3, 6, or 12 billing cycles.
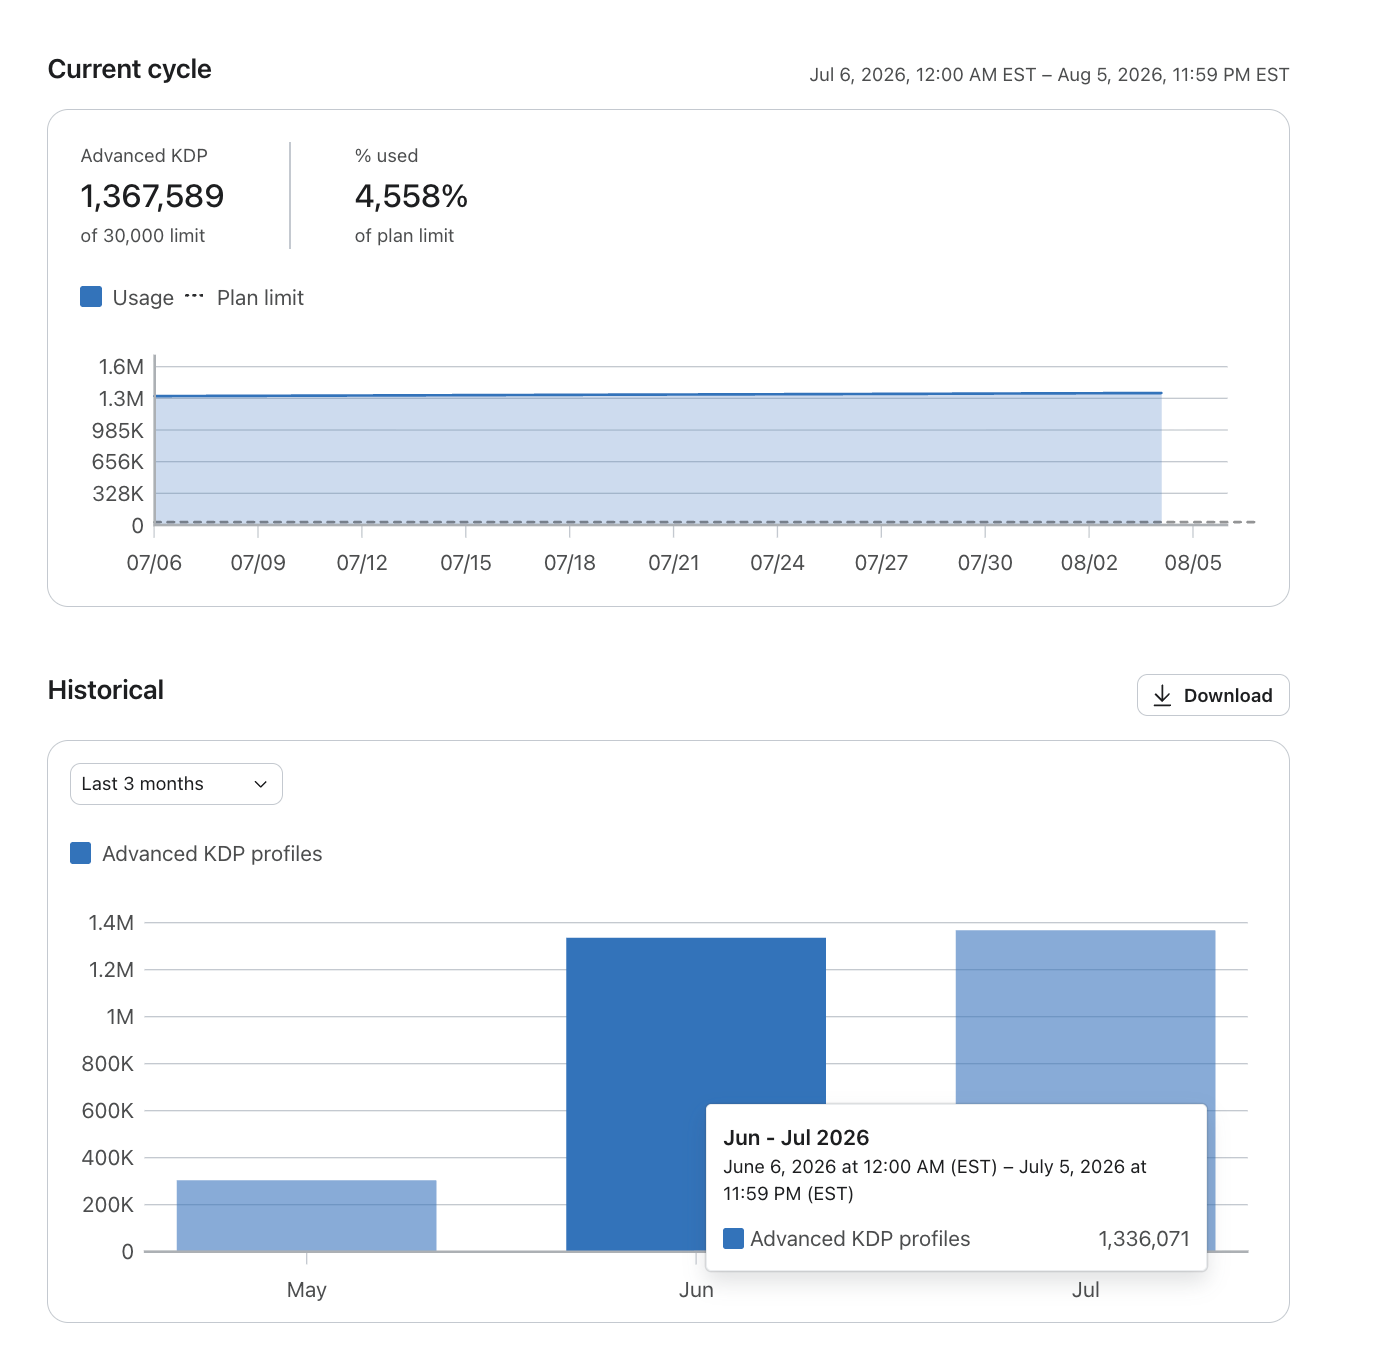
Advanced Klaviyo Data Platform usage
View Current & Historical AKDP Usage
Advanced Klaviyo Data Platform (AKDP) is metered on Total Profiles.
This graph shows the number of Advanced KDP profiles you had per billing cycle. You can review the total profile count over the past 3, 6, or 12 billing cycles.
Customer Hub Usage
Customer Hub is metered on Active Profiles. As such, the usage information for Customer Hub in included in the Active Profiles graph above.
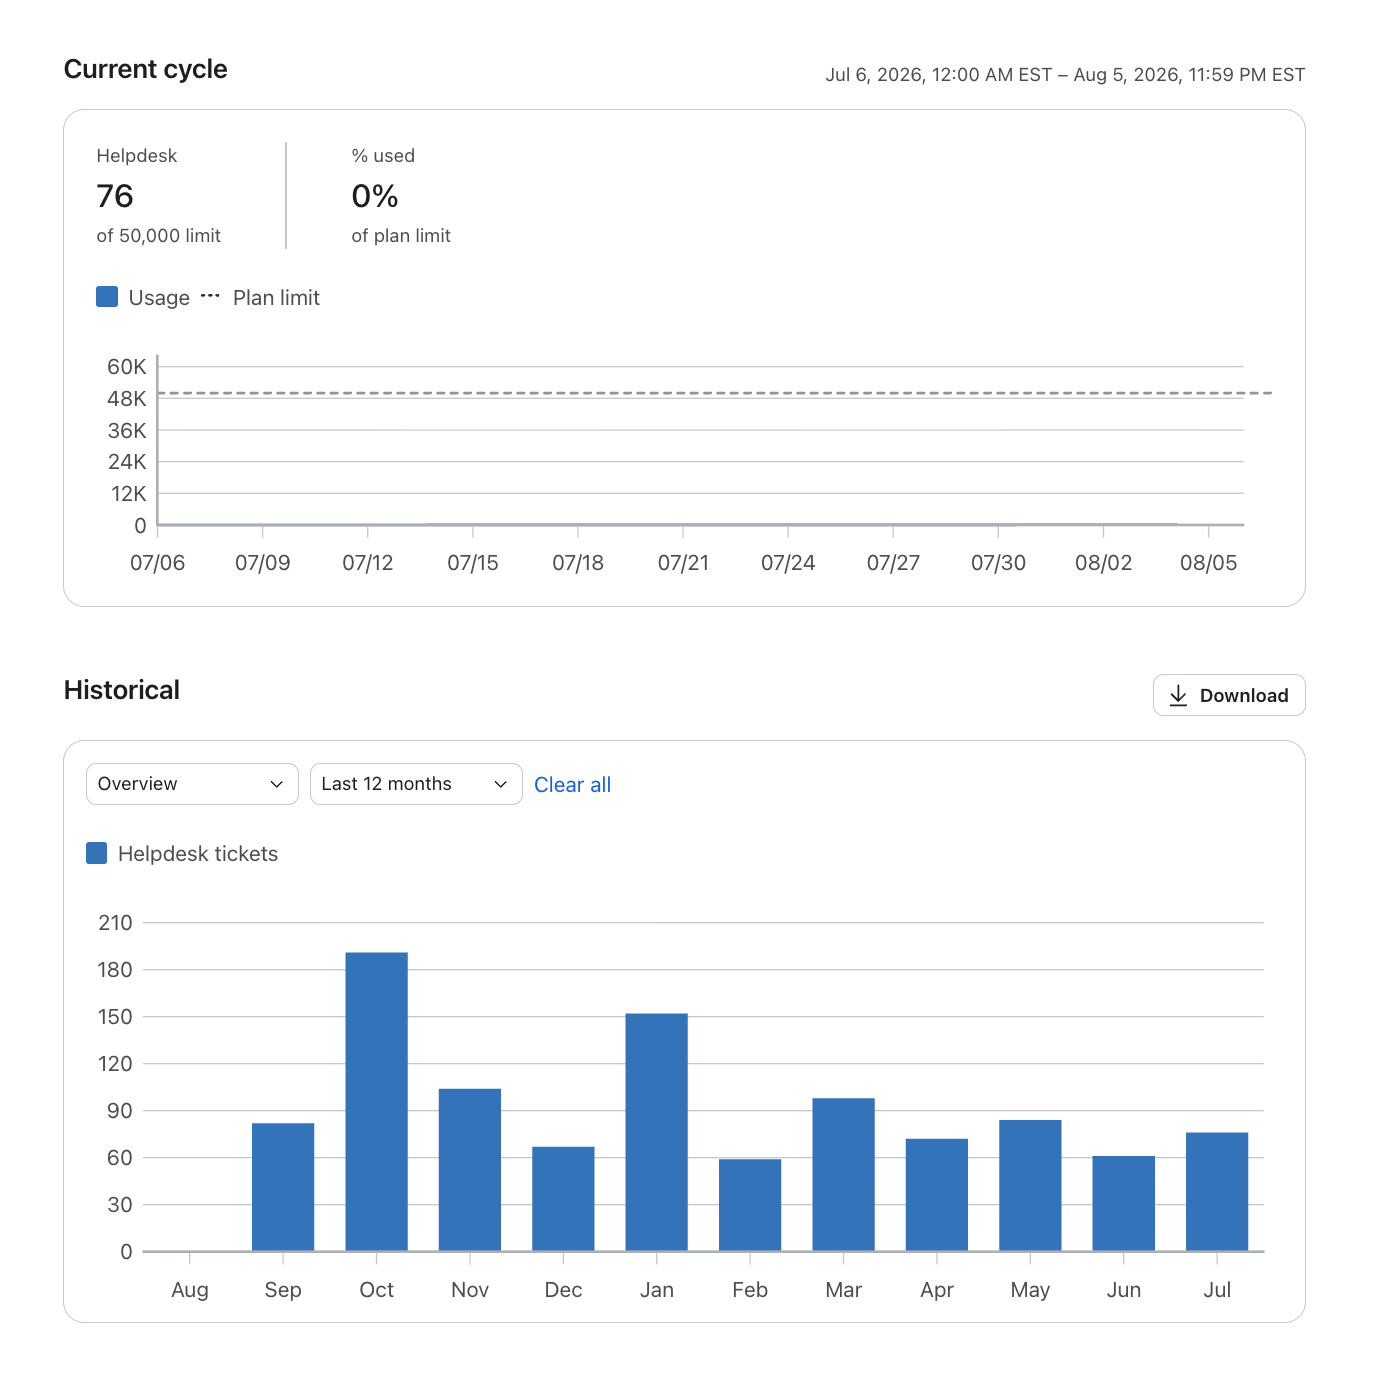
Helpdesk Usage
View Current & Historical Helpdesk Usage
This graph shows the number of Helpdesk tickets that have been opened per billing cycle. You can review the total count over the past 3, 6, or 12 billing cycles.
You can also view a channel breakdown of where your tickets have originated.
Customer Agent Usage
View Current & Historical Customer Agent Usage
This graph shows the number of Customer agent conversations that have been resolved per billing cycle. You can review the total count over the past 3, 6, or 12 billing cycles.
You can also filter your graph to show a channel breakdown of where conversations have originated.
Klaviyo Social Usage
Klaviyo Social Marketing is metered on Active Profiles. As such, the usage information for Social Marketing in included in the Active Profiles graph above.
Download your account usage
If you are looking for a more detailed report of your past account usage, you can download a report of your usage here. Your report can be formatted either as a CSV or in Google Sheets.
1. First, click the download button.
2. Then, select your inputs in the modal that appears.
3. Then, check for the notification in your Klaviyo in-app notifications on the upper right hand corner of the page.